Join Our Telegram channel to stay up to date on breaking news coverage
Litecoin Price Prediction – March 20
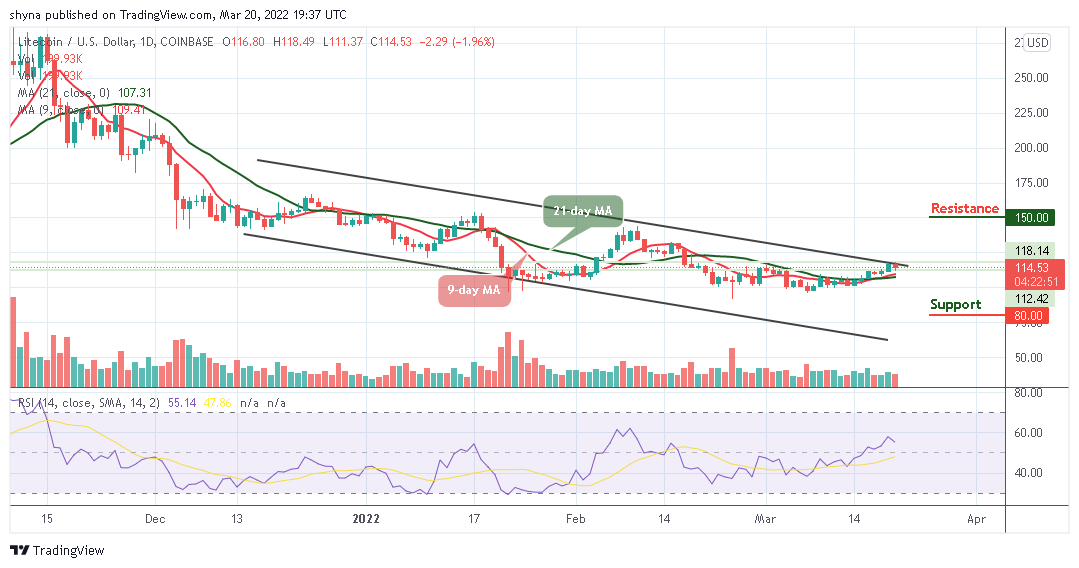
The Litecoin price prediction is likely to face a sharp decline with a loss of 1.96% heading towards the 9-day moving average.
LTC/USD Market
Key Levels:
Resistance levels: $150, $160, $170
Support levels: $80, $70, $60

LTC/USD is facing a downtrend as the coin begins to drop towards the 9-day and 21-day moving averages. However, the Litecoin price failed to break above the resistance level of $118 as it’s been restricted from crossing the upper boundary of the channel. More so, the buyers may need to keep the price movement above the 9-day and 21-day moving averages so as a clear break of the channel may take the coin up to the nearest resistance level of $125 level.
Litecoin Price Prediction: Litecoin (LTC) May Cross Below 9-day MA
The Litecoin price may continue to experience a downtrend if the nearest support of $110 gives way. However, sellers may be more dominant if the bears continue to post firm commitment as the technical indicator Relative Strength index (14) shows a slight downtrend on the chart.
Nevertheless, traders could see a sharp drop below the 9-day and 21-day moving averages if the market price drops more; breaking this barrier could further weaken the market to hit the supports at $80, $70, and $60. Therefore, if the buyers manage to fuel the market, traders may expect a further increase above the upper boundary of the channel which could locate the resistance levels of $150, $160, and $170 respectively.
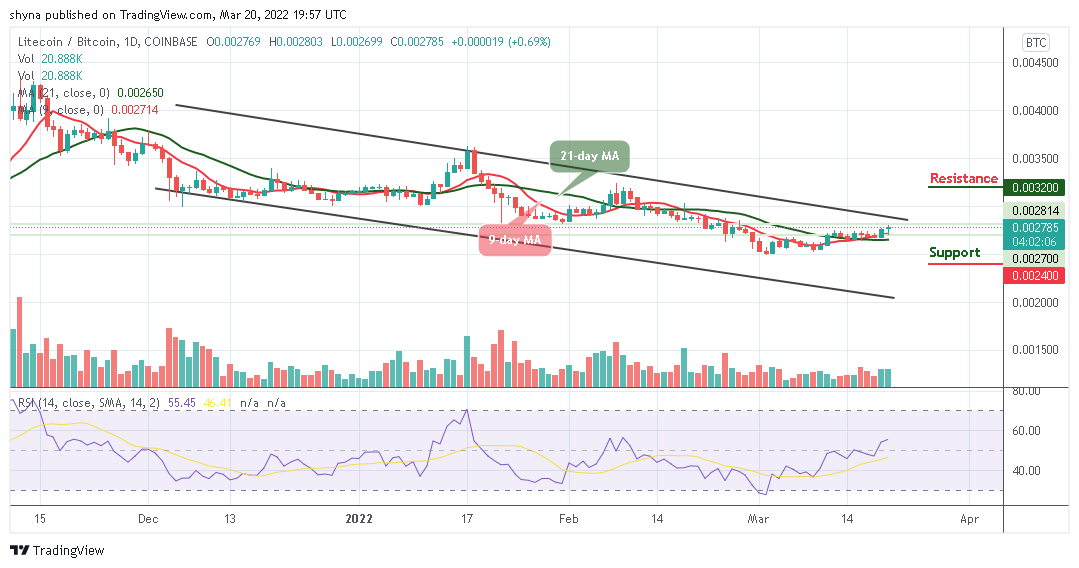
Against BTC, the Litecoin price keeps operating above the 9-day and 21-day moving averages. However, if the bullish movement continues, the resistance level of 3000 SAT is expected to be visited; more so, there might be a reason to expect the long-term bullish reversal as the red-line of the 9-day MA is still above the green-line of the 21-day MA.

In other words, if the Litecoin price crosses below the moving averages, it could refresh lows under 2600 SAT, and a possible bearish continuation may likely meet the major support at 2500 SAT before falling to 2400 SAT and below while the buyers may push the coin to the potential resistance at 3200 SAT and above if the bulls successfully push the coin above the channel. Meanwhile, to support the bullish movement, the technical indicator Relative Strength Index (14) moves above 50-level to give more bullish signals.
Looking to buy or trade Litecoin (LTC) now? Invest at eToro!
68% of retail investor accounts lose money when trading CFDs with this provider
Join Our Telegram channel to stay up to date on breaking news coverage

