Join Our Telegram channel to stay up to date on breaking news coverage
Bitcoin Price Prediction – March 19
The Bitcoin price prediction increases during the European session, but despite the retreat, the market is still moving sideways.
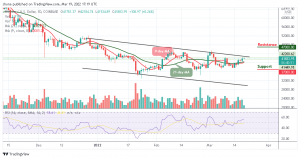
BTC/USD Long-term Trend: Ranging (Daily Chart)
Key levels:
Resistance Levels: $47,000, $49,000, $51,000
Support Levels: $37,000, $35,000, $33,000

BTC/USD retreats as the bears are seen forcing the king coin to bow down to fresh losses. The first digital asset is moving sideways above the 9-day and 21-day moving averages. At the time of writing, BTC/USD is changing hands at $41,883 after adjusting from the resistance level of $42,184 which is an intraday high. Moreover, the Bitcoin price may be vulnerable to losses if the price crosses below the moving averages.
Bitcoin Price Prediction: Bitcoin (BTC) Bears May Resurface
Looking at the Bitcoin price from a technical angle, one can say that the market price may likely follow the downtrend or continue to move sideways because the bullish movement is yet to be visible unless the 9-day MA crosses above the 21-day MA. However, the technical indicator Relative Strength Index (14) may confirm the bearish movement if the signal line drops below 50-level.
However, bulls are currently banking on the moving averages to ensure that despite a reversal, the Bitcoin price stays above this barrier. Any bearish movement below this could push the coin towards the lower boundary of the channel and may cause the coin to reach the critical supports at $37,000, $35,000, and $33,000. Following the upward movement, if the coin crosses above the upper boundary of the channel, it may hit the potential resistance levels at $47,000, $49,000, and $51,000 respectively.
BTC/USD Medium – Term Trend: Ranging (4H Chart)
As the 4-hour chart reveals, the Bitcoin price is likely to cross below the 9-day and 21-day moving averages while the bulls are trying to defend the $41,500 support. If not, the support level of$40,000 and below may come into play if the coin focuses on the downward movement.
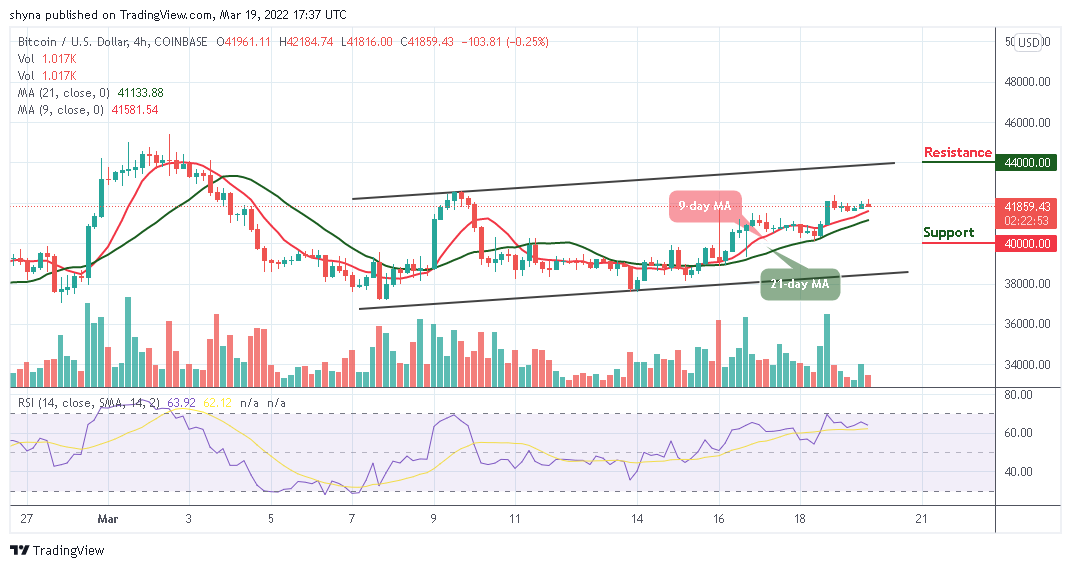
Moreover, buyers may need to regroup and hold the support of $41,800, once this is done, traders may expect a move towards the upper boundary of the channel, and breaking this barrier may push the king coin to the resistance levels of $44,000, $46,000, and $48,000. Meanwhile, the technical indicator Relative Strength Index (14) is likely to drop below 60-level, suggesting a bearish movement.
Looking to buy or trade Bitcoin (BTC) now? Invest at eToro!
68% of retail investor accounts lose money when trading CFDs with this provider
Read more:
- How to buy Bitcoin
- How to buy Cryptocurrency
Join Our Telegram channel to stay up to date on breaking news coverage