Join Our Telegram channel to stay up to date on breaking news coverage
Litecoin Price Prediction – March 22
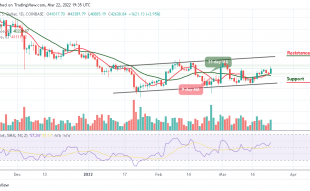
The Litecoin price prediction reveals that LTC is moving bullishly with a gain of 5.05%, as the coin prepares to cross above the channel.
LTC/USD Market
Key Levels:
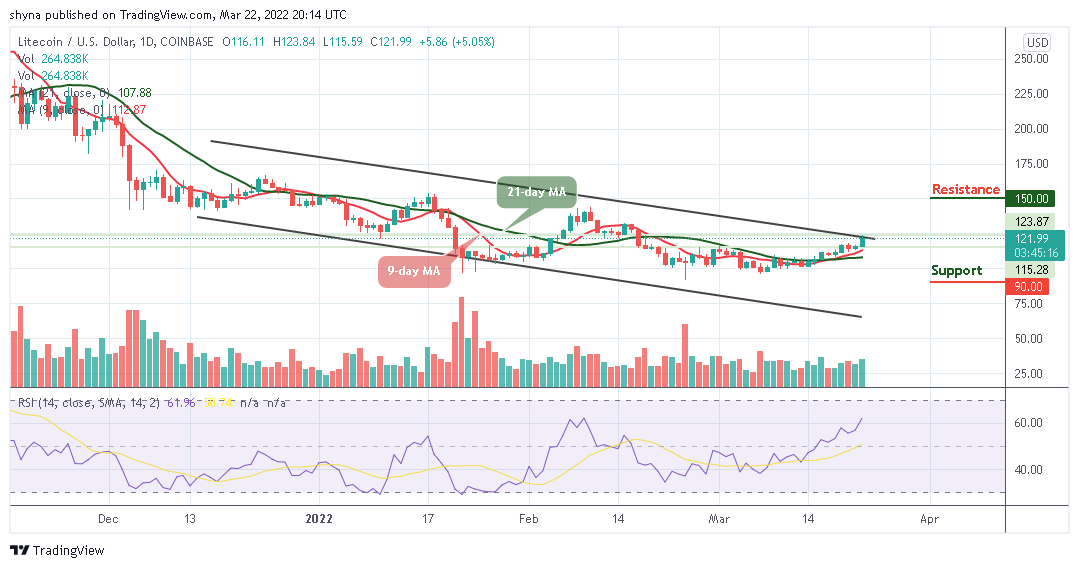
Resistance levels: $150, $160, $170
Support levels: $90, $80, $70
LTC/USD is seen trading in the green at the time of writing as the coin is ready to cross above the upper boundary of the channel with a gain of 5.08%. According to the daily chart, the candle formation is currently respecting the upward movement but crossing below the 9-day and 21-day moving averages might position the market price towards the south as the closest support level is located around the $100 level.
Litecoin Price Prediction: Litecoin Price May Spike to the Upside
The Litecoin price is currently above the 9-day and 21-day moving averages. Meanwhile, an increase above this barrier could trigger intense buying to the resistance levels of $150, $160, and $170. On the contrary, the Litecoin price may likely hold a support level at $110 which could be the daily low. Therefore, if the Litecoin price drops below this support level, it may likely hit the closest support at $100.
Meanwhile, the critical support after this could be located around $90, $80, and $70 levels if the selling volume keeps increasing. More so, the technical indicator Relative Strength Index (14) reveals that the market may gain more upwards if the signal line keeps moving above 60-level.
When compared with Bitcoin, the buyers are pushing the coin above the 9-day and 21-day moving averages. Meanwhile, from the upside, the nearest level of resistance lies above the upper boundary of the channel at 3200 SAT and above as the technical indicator Relative Strength Index (14) crosses above 60-level.
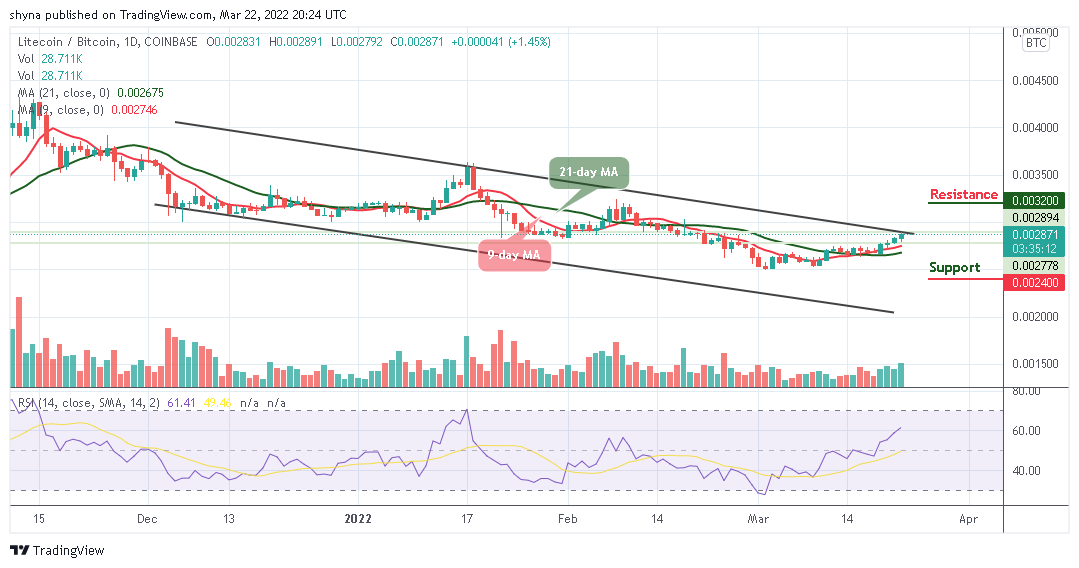
Looking at the downside; the nearest level of support is 2500 SAT, if the price drops further to create a new low, lower support could be found at 2400 SAT and below. In addition, if the 9-day MA crosses below the 21-day MA, this could mean that the market may remain at the downside.
Looking to buy or trade Litecoin (LTC) now? Invest at eToro!
68% of retail investor accounts lose money when trading CFDs with this provider
Join Our Telegram channel to stay up to date on breaking news coverage