


Join Our Telegram channel to stay up to date on breaking news coverage
LTC Price Prediction – April 11
Despite the downward trend, Litecoin maintains a higher low pattern over a short-term ascending channel.
LTC/USD Market
Key Levels:
Resistance levels: $52, $54, $56
Support levels: $32, $30, $28
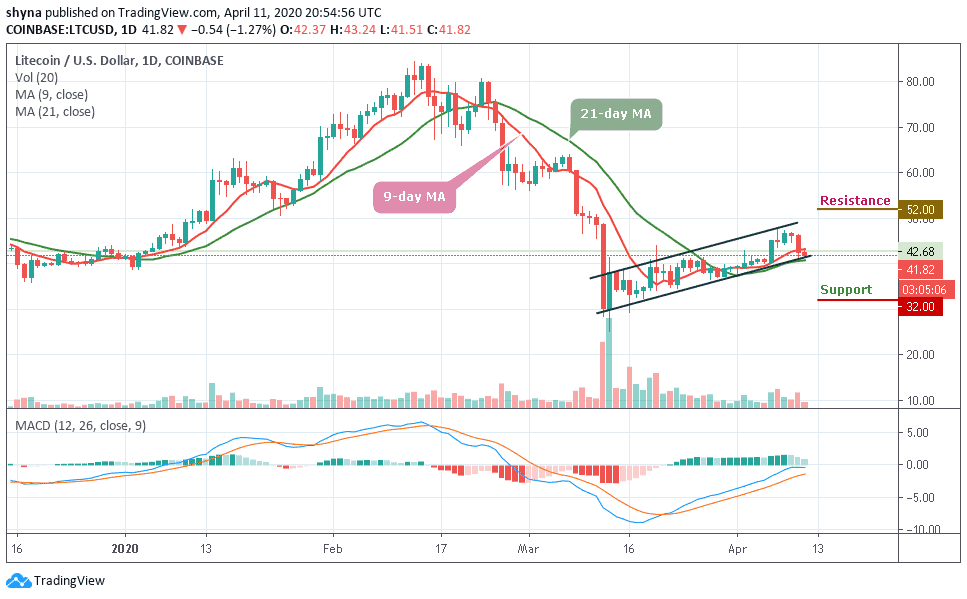
In the last two days, LTC/USD recorded losses. The improvement the coin faced today was short-lived and the price is back to around $41. As the market opens today, the price peaked at $43.56 and a low at $41.83 where the coin is changing hands currently. Looking at the daily chart, we can see that LTC is still sitting at $41 level.
Therefore, if the price level can be maintained, we could consider a buyback with $42 resistance before breaking above the 9-day moving average to cross the upper boundary of the channel while the nearest resistance levels lie at $52, $54 and $56. But as it stands now, the bears are attempting to visit close supports before climbing higher.
In addition, the Litecoin price is still trading well in an ascending channel formation, which shows that the market is undecided. If the price fluctuates below the channel limit, which corresponds to the support at $40, we can expect the LTC market to continue its downward pressure and the price could slip to the critical supports at $32, $30 and $28 respectively.
In other words, the MACD for Litecoin remains in negative areas, confirming the downward market dynamics. A drive above the zero-level can bring the market back into a green zone.
Comparing LTC with BTC, we can easily see that the pair has eventually broken solid support at 6200 SAT. The Litecoin price could see another sharp drop at the 6050 SAT support level. Breaking this level could further take the price to the critical support levels at 5800 SAT and 5600 SAT below the moving averages of 9-day and 21-day.
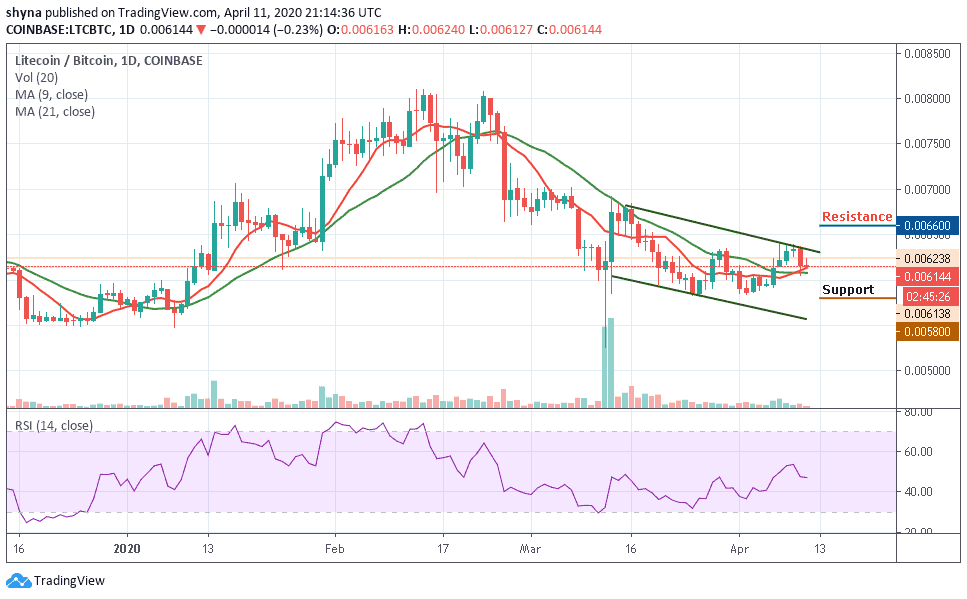
However, the Litecoin price is trading at the 6144 SAT level, if the bulls can hold the price as it is and move the market upward, the next key targets for the bulls lie at 6300. Reaching these levels might take it to the potential resistance levels of 6600 SAT and 6800 SAT. Meanwhile, the RSI (14) is moving around 47-level.
Please note: Insidebitcoins.com is not a financial advisor. Do your research before investing your funds in any financial asset or presented product or event. We are not responsible for your investing results.
Join Our Telegram channel to stay up to date on breaking news coverage
