Join Our Telegram channel to stay up to date on breaking news coverage
Bitcoin (BTC) Price Prediction – April 11
The cryptocurrency market has remained gloomy since the massive decline of yesterday.
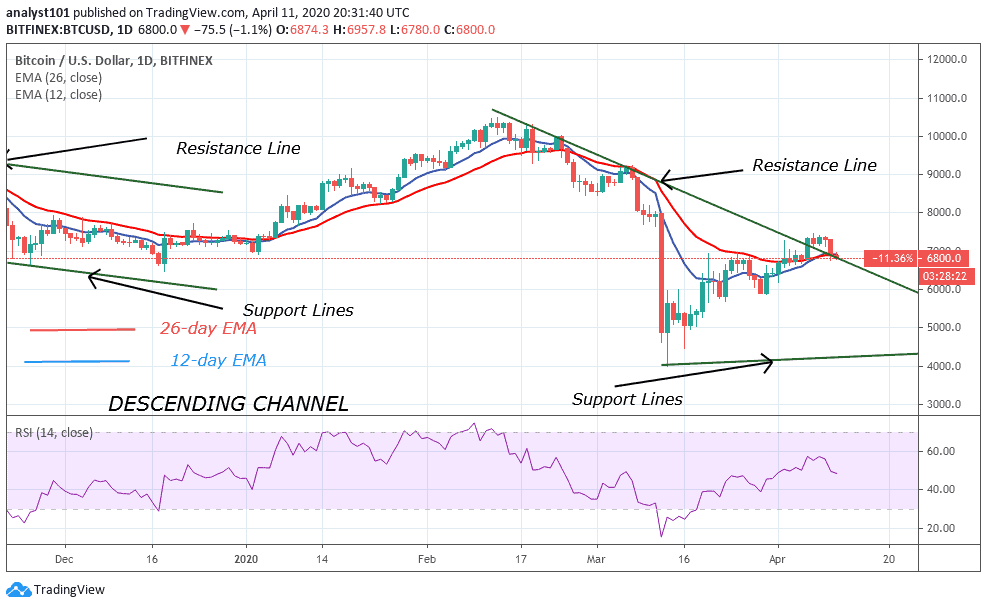
BTC/USD Long-term Trend: Bullish (Daily Chart)
Key levels:
Resistance Levels: $9,000, $9,500 $10,000
Support Levels: $7,000, $6,500, $6,000

BTC/USD has been struggling to maintain its position above $7,000 and its price saw another dive below the $6,800 level today. The coin could be in a dangerous position if the price slips below the support level of $6,500. However, if the breakthrough is confirmed, the downside momentum may gain traction with the next focus on $6,000. At the time of writing, Bitcoin is trading below the 9-day moving average at $6,782.02 with a decline of 1.31% on the daily price chart.
Meanwhile, the prevailing trend is bearish with expanding volatility. The leader of cryptocurrencies currently consolidates within the ascending channel. A break down below this pattern may continue in the direction of the previous trend. In this case, the Bitcoin price may cross below the lower boundary of the channel.
However, in as much as the bulls could not move the coin to the north; we may see a price cut to $6,000 vital support. A further low drive could send the price to $5,800, $5,600 and $5,400 support levels while the resistance levels to watch are $8,000, $8,200 and $8,400. MACD indicator suggested a probable bullish crossover in the near future.
BTC/USD Medium-Term Trend: Bearish (4H Chart)
Looking at the 4-hour chart, the bears have been dominating the market tremendously, but the bulls are trying to defend the $6,600 support as well. Meanwhile, the $6,500 and below may come into play if BTC breaks below the mentioned supports.
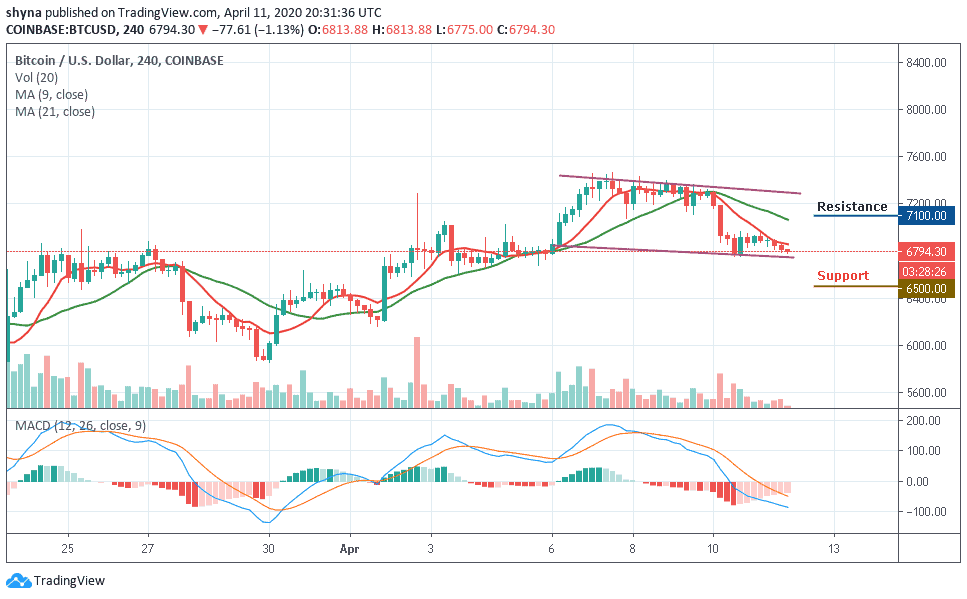
Meanwhile, if the buyers can reinforce and power the market, traders may expect a retest at $7,000 resistance level and breaking this level may further allow the bulls to reach $7,100 and above. At the moment, the MACD signal lines are crossing to the negative side which may give more bearish signals in the near future.
Please note: Insidebitcoins.com is not a financial advisor. Do your research before investing your funds in any financial asset or presented product or event. We are not responsible for your investing results.
Join Our Telegram channel to stay up to date on breaking news coverage