Join Our Telegram channel to stay up to date on breaking news coverage
LTC Price Prediction – December 16
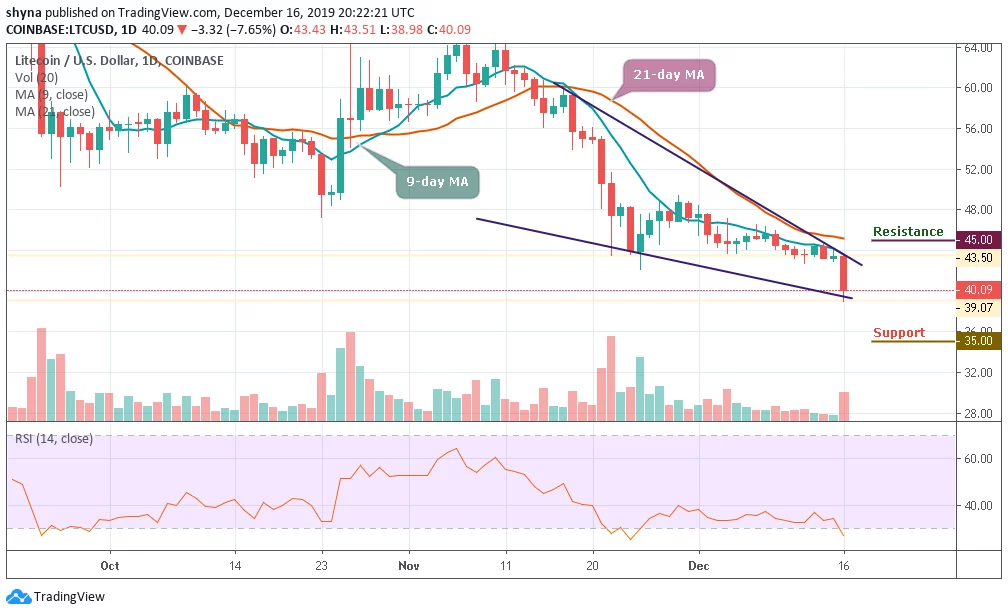
In the recent price fall, LTC/USD fell 7.65% and a new wave low has been formed while the support level of $40 has been broken.
LTC/USD Market
Key Levels:
Resistance levels: $45, $47, $49
Support levels: $35, $33, $31
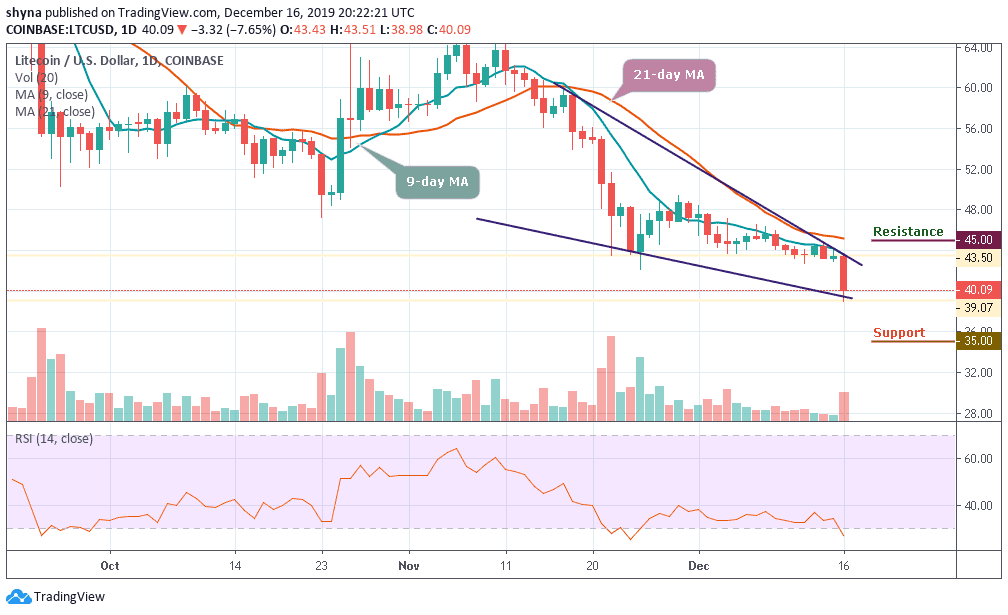
Litecoin price has taken the downhill road. In the past few days, LTC/USD was spotted dealing at $44, and then later dribbled to $40. The tremendous loss in the price is indicating a delayed recovery. However, Litecoin has given some great results in the past. but the coin is speculated to retain the same momentum in some time. The current market pressure seems to take a while, but once it is lifted, the coin could once again shine.
However, in as much as the coin fails to rally from current trading levels, the greater the chance that we may see the Litecoin cryptocurrency price falling to a new month trading low. A break below the $39 support level may provoke an even deeper decline towards the $35, $33 and $31 levels. The short-term technical analysis by some of the best trading platforms shows that the $40 and $39 levels are currently the strongest forms of technical support.
Similarly, looking at the daily chart, a break above the $43 level will propel Litecoin to a high of $45, $47 and $49 resistance levels. Meanwhile, the RSI (14) is at the oversold zone indicating that the bulls may soon take control of the market.
Against Bitcoin, LTC has clearly experienced difficulties, especially in the past few weeks. The coin recently broke under solid support at 5900 SAT and continued to fall through subsequent support level to 5800 SAT. The critical support level is located at the 5400 SAT and below.
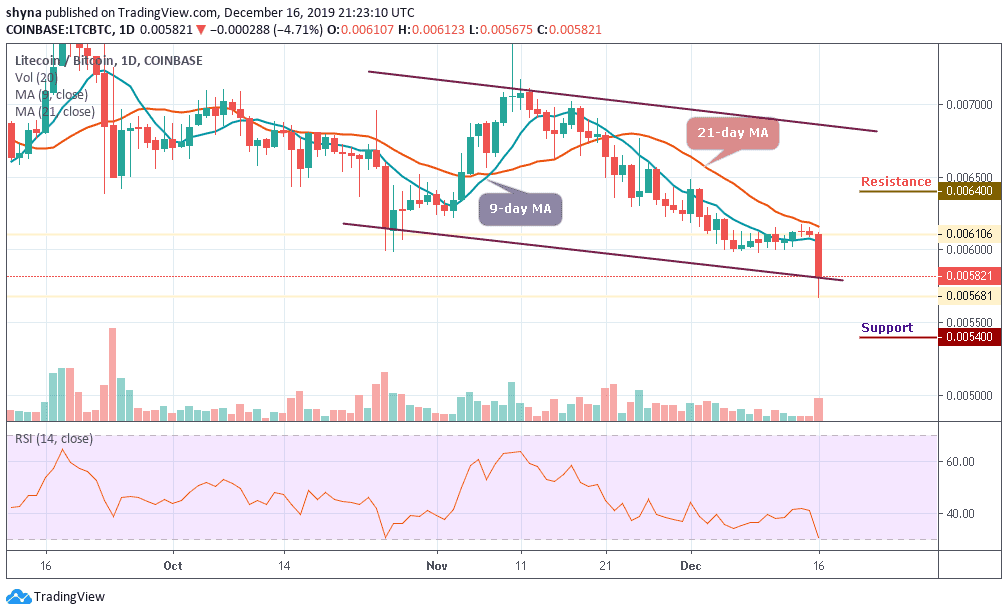
However, if the bulls manage to power the market, we may likely find the resistance level at 6400 SAT and above. More so, the Litecoin price is currently changing hands at 5821 SAT and a surge in volatility may occur as the RSI (14) is about entering into the oversold zone.
Please note: Insidebitcoins.com is not a financial advisor. Do your research before investing your funds in any financial asset or presented product or event. We are not responsible for your investing results.
Join Our Telegram channel to stay up to date on breaking news coverage