Join Our Telegram channel to stay up to date on breaking news coverage
Litecoin Price Prediction – June 10
The Litecoin price will soon need to stage a meaningful short-term rally or the coin could see a worrying decline back towards the $150 support level.
LTC/USD Market
Key Levels:
Resistance levels: $245, $265, $285
Support levels: $85, $65, $45
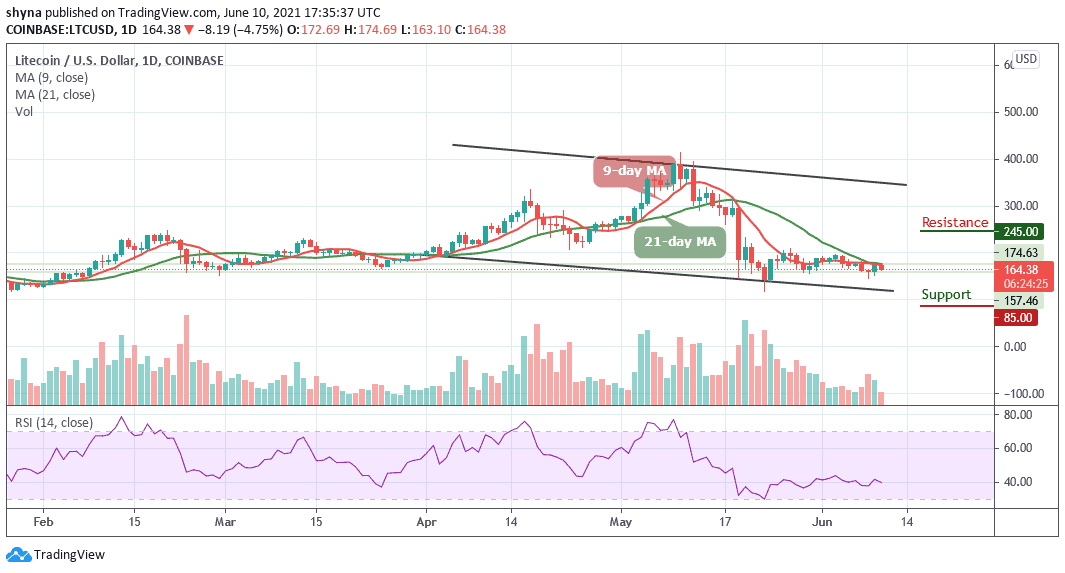
LTC/USD is still trapped in an incredibly narrow trading range after a bullish rally failed to materialize several times. Yesterday, an early day rally towards the $180 level failed to generate sustainable gains, with the Litecoin price slipping back below the 9-day and 21-day moving averages. Meanwhile, the longer that Litecoin (LTC) fails to rally from current trading levels, the greater the chance that traders may see the cryptocurrency falling to a new month’s trading low.
Litecoin Price Prediction: Sideways Movement May Continue for LTC
According to the daily chart, the Litecoin price keeps moving sideways. Meanwhile, the continuous bearish movement below the 9-day and 21-day moving averages may provoke an even deeper below the lower boundary of the channel and could move towards the support levels of $85, $65, and $45. Moreover, the short-term technical analysis shows that the $165 and $160 levels are currently the strongest forms of technical support before the $145 level could come into focus.
However, the daily chart highlights that the $175 level is a key technical region in which bulls need to break. Further bullish movement above the 9-day and 21-day moving averages could reach the resistance levels at $245, $265, and $285. The technical indicator Relative Strength Index (14) is likely to break below 40-level which may likely cause the market to enter into the downtrend.
Looking to buy or trade Litecoin (LTC) now? Invest at eToro!
75% of retail investor accounts lose money when trading CFDs with this provider
With Bitcoin comparisons, the Litecoin price stays below the 9-day and 21-day moving averages. Presently, sellers are controlling the market as they may likely drag the price below the lower boundary of the channel while the Relative Strength Index (14) moves below 40-level which may welcome more bearish signals into the market.
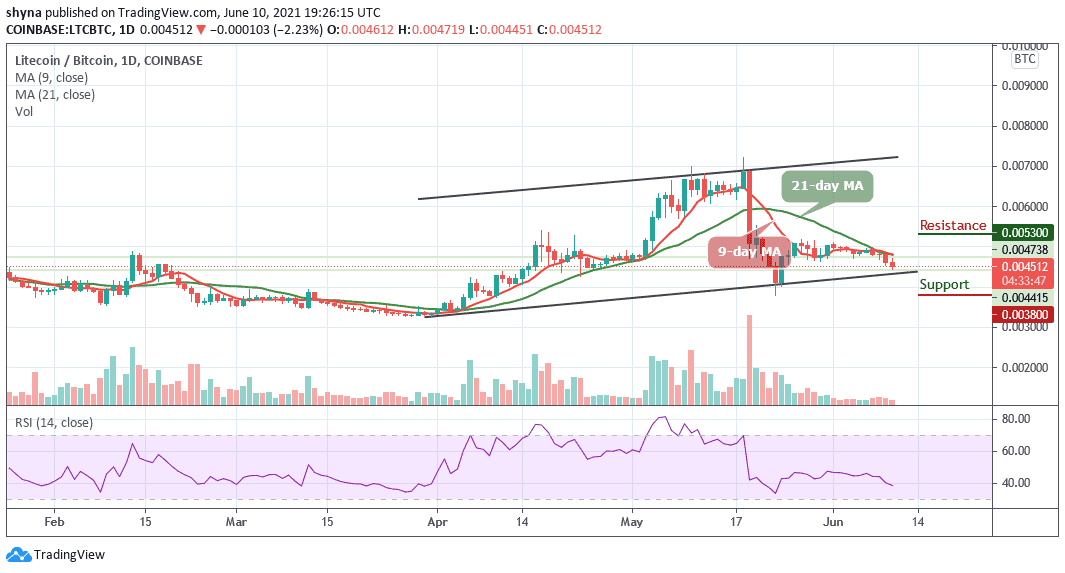
However, the technical indicator keeps pushing the sellers to increase their entries. More so, if the bears succeeded in breaking the price below the channel, traders would expect the market to fall to the support level of 3800 SAT and below. Meanwhile, a rebound above the 9-day and 21-day moving averages could increase the bullish movement to the 5300 SAT and above.
Looking to buy or trade Litecoin (LTC) now? Invest at eToro!
75% of retail investor accounts lose money when trading CFDs with this provider
Join Our Telegram channel to stay up to date on breaking news coverage