Join Our Telegram channel to stay up to date on breaking news coverage
LTC Price Prediction – January 16
LTC/USD is moving down synchronously within the market and its sell-offs may be extended towards a psychological $50.
LTC/USD Market
Key Levels:
Resistance levels: $64, $66, $68
Support levels: $45, $43, $41
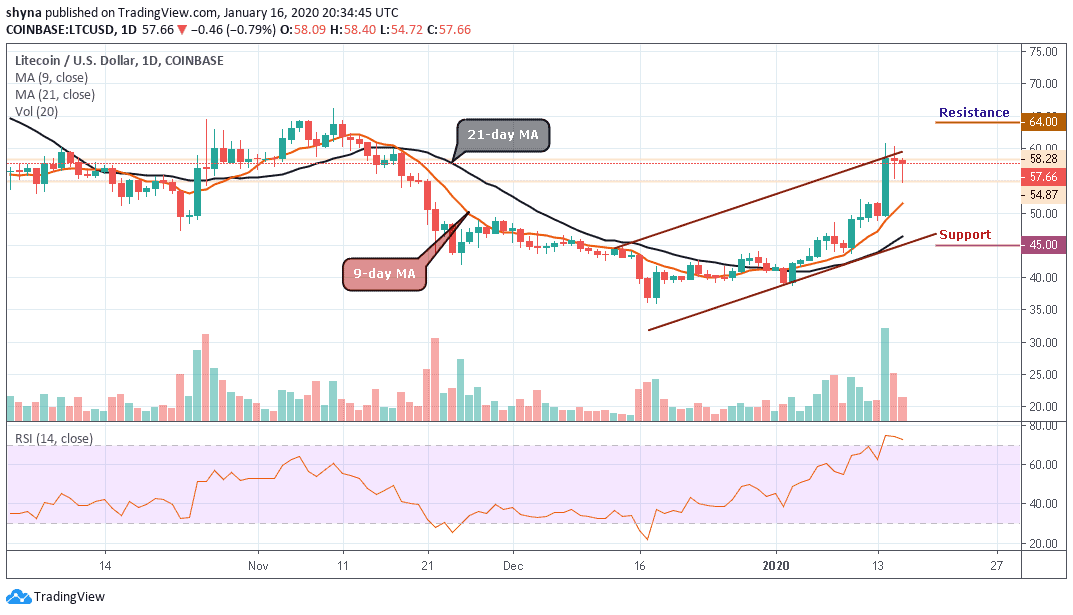
Litecoin, which is currently the 7th largest digital coin with a current market value of $3.67 billion, has lost more than 0.79% in the past 24 hours amid the global correction in the market for crypto-currencies. Bitcoin also pulled out of recent highs when the bulls hit the pause button. At the time of writing, the LTC/USD is changing hands to $57.66, down from the recent high of $58.28.
At the moment, the coin is moving synchronously above the 9-day and 21-day moving averages on the market. The price of Litecoin is mainly influenced by speculative sentiment and technical factors, while fundamental developments remain in the shadows. The cryptocurrency market is known for its herd behavior because everything grows and falls simultaneously.
However, LTC/USD tested area above $58, more so, the bulls failed to hold the ground. the wide-spread retracement on the market pushed the coin towards $54 with the next local support created by $50, which is the intraday low. In addition, the critical barrier awaits us on approach to $45. This level is likely to limit the correction and serve as a jumping-off ground for another bullish wave; however, Once it is out of the way, the sell-off is likely to gain traction with the next focus on $43 and $41 support levels.
Meanwhile, on the upside, the initial resistance is created by the upper line of the ascending channel at $60. We will need to see a sustainable move above this level to retest $62. The further bullish movement could touch the $64, $66 and $68 resistance levels considering that the daily RSI (14) remains within the overbought zone.
When compared with BTC, the price in Litecoin is preparing to start moving in sideways well above the 9-day and 21-day moving averages. The number seven crypto on the market cap is yet to define its real direction because the market movement has remained clouded by both the bullish and the bearish prices since yesterday.
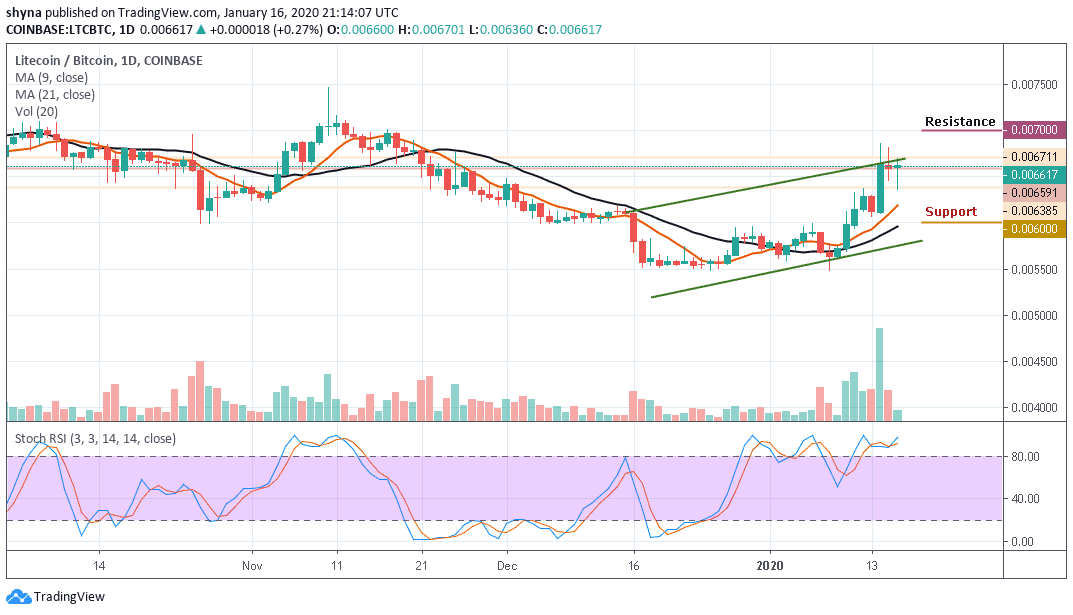
However, as the stochastic RSI moves within the overbought territory, a bearish step back may likely roll the market back below the moving averages and to the support of 6100 SAT with a possible break down and further declines could be at 6000 SAT and below, establishing a new weekly low for the market. The resistance levels to watch are 7000 SAT and above.
Please note: Insidebitcoins.com is not a financial advisor. Do your research before investing your funds in any financial asset or presented product or event. We are not responsible for your investing results.
Join Our Telegram channel to stay up to date on breaking news coverage