Join Our Telegram channel to stay up to date on breaking news coverage
LTC Price Prediction – February 24
Litecoin (LTC) is still trading well inside a rising channel formation, which shows that the bulls are in control.
LTC/USD Market
Key Levels:
Resistance levels: $88, $90, $92
Support levels: $66, $64, $62
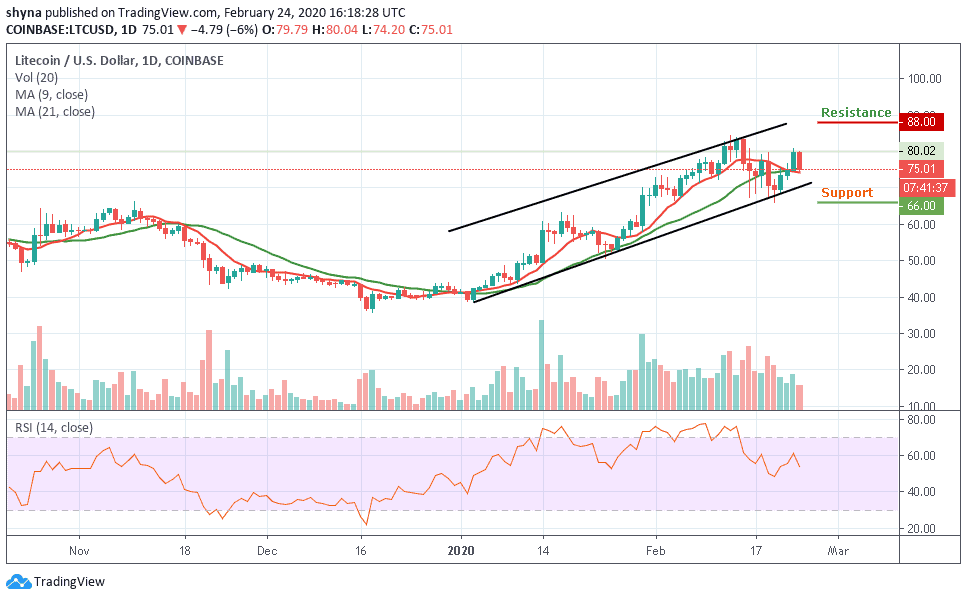
The February 21 rebound has made LTC/USD to record a high at $80.85 after relying upon strong support at $66. Since February 15, the price of LTC has been trading below $83 due to the recent bearish surge. For this reason, the market has currently dropped by -6%, which may become more severe if we see immense selling pressure. However, the market is showing weakness but still looks bullish in the short-term.
Looking at the market structure, we can see that LTC/USD is still sitting at $75. If the price level can hold well, we may see a buyback at $78 resistance before breaking up to $80 and above. But as it stands now, the RSI (14) nosedives the bears are attempting to visit close supports once again before climbing higher to the nearest resistance at $88, $90 and $92 levels.
On the daily chart, Litecoin is caught in a rising channel pattern since the year started as the bulls gain control of the long-term market. Meanwhile, the short-term trend is still projecting a bearish outlook for the LTC market. Considering the latest price drop, the market is likely to fall at $66, $64 and $62 support levels, meeting the channel’s lower boundary.
Against Bitcoin, LTC fell lower as it breaks beneath the 7700 SAT. However, LTC/BTC is currently trading at 7663 SAT as the bulls are trying to prevent it from heading further lower. From above, the nearest level of resistance lies at 8300 SAT. Higher resistance is expected at 8500 SAT and 8700 SAT.
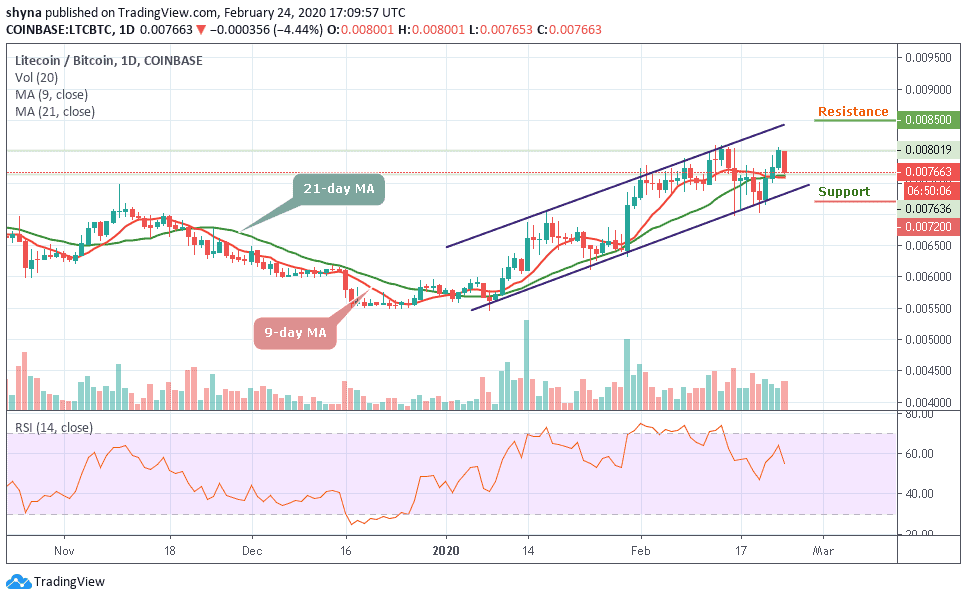
In other words, the nearest level of support lies at 7400 SAT. Beneath this, support is located at 7200 SAT and then at 7000 SAT. The trading volume has increased during the latest round of selling. The RSI (14) is poised for a bearish movement as the signal line nosedives towards the south.
Please note: Insidebitcoins.com is not a financial advisor. Do your research before investing your funds in any financial asset or presented product or event. We are not responsible for your investing results.
Join Our Telegram channel to stay up to date on breaking news coverage