Join Our Telegram channel to stay up to date on breaking news coverage
LTC Price Prediction – May 9
LTC/USD is moving down synchronously within the market and its sell-offs may be extended below the moving averages.
LTC/USD Market
Key Levels:
Resistance levels: $55, $57, $59
Support levels: $40, $38, $36
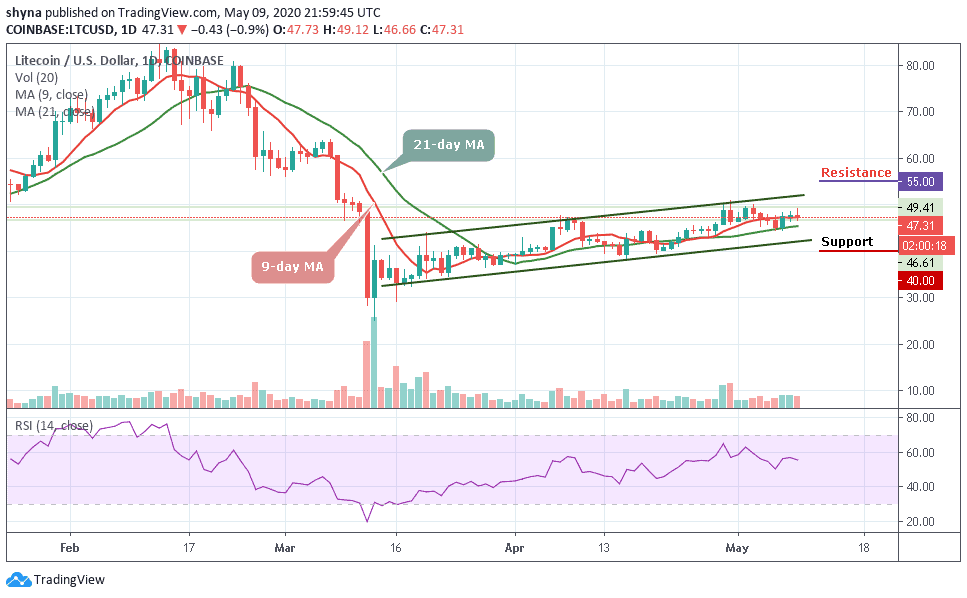
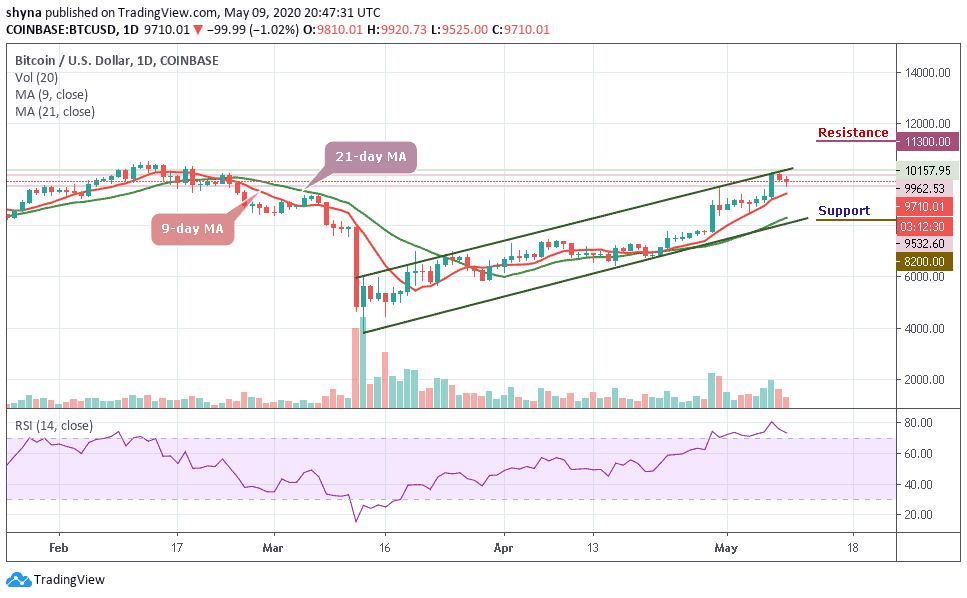
At the time of writing, the LTC/USD is changing hands to $47.31, down from the recent high of $49.41. The coin is moving synchronously above the 9-day and 21-day moving averages on the market. The price of Litecoin is mainly influenced by speculative sentiment and technical factors, while fundamental developments remain in the shadows. The cryptocurrency market is known for its herd behavior because everything grows and falls simultaneously.
However, LTC/USD tested area above $48, and the bulls failed to hold the ground. The wide-spread retracement on the market pushed the coin towards $46 with the next local support created by $45. This level is likely to limit the correction and serve as a jumping-off ground for another bullish wave.
However, the sell-off is likely to gain traction with the next focus on $40, $38, and $36 support levels. Meanwhile, on the upside, the initial resistance is created by the upper line of the ascending channel at $52. Traders may need to see a sustainable move above this level to test $54. The further bullish movement could touch the $55, $57, and $59 resistance levels considering that the daily RSI (14) moves around 56.44-level.
Against Bitcoin, the Litecoin price is experiencing a tremendous downtrend, as the coin continues to move below the 9-day and 21-day moving averages. The bulls are making an attempt to push the market above the 9-day moving average as the technical indicator is moving out of the oversold zone. Nonetheless, the critical support level is located around the 4300 SAT and below.
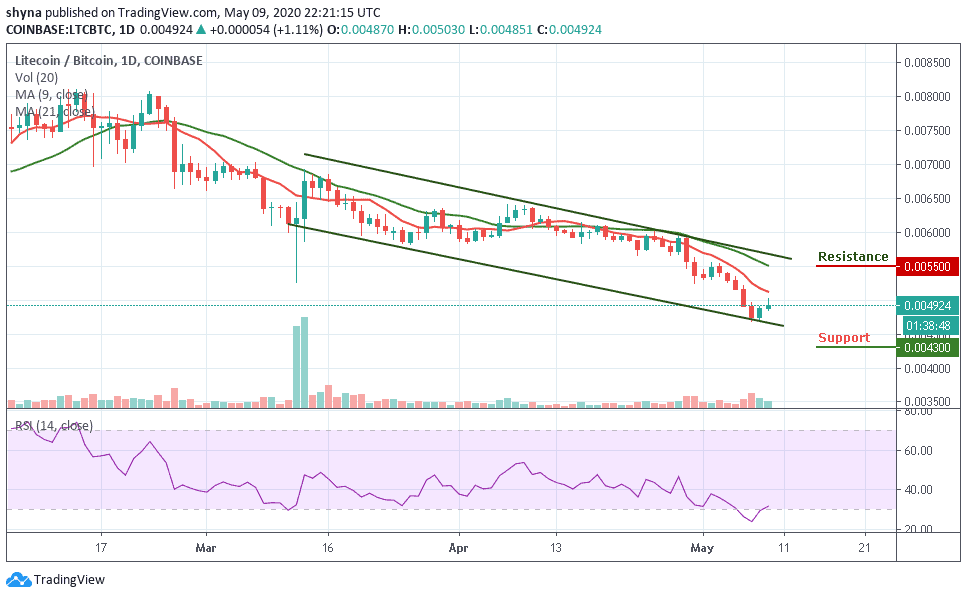
However, if the bulls can continue to power the market, the coin may likely cross the moving averages and find the resistance level at 5500 SAT and above. Meanwhile, the price of Litecoin is currently changing hands to 4924 SAT and a spike in volatility could occur according to the RSI (14).
Please note: Insidebitcoins.com is not a financial advisor. Do your research before investing your funds in any financial asset or presented product or event. We are not responsible for your investing results.
Join Our Telegram channel to stay up to date on breaking news coverage