Join Our Telegram channel to stay up to date on breaking news coverage
LTC Price Prediction – August 6
The Litecoin price may retest the monthly high of $65.34 if the upside momentum gains traction.
LTC/USD Market
Key Levels:
Resistance levels: $66, $68, $70
Support levels: $53, $51, $49
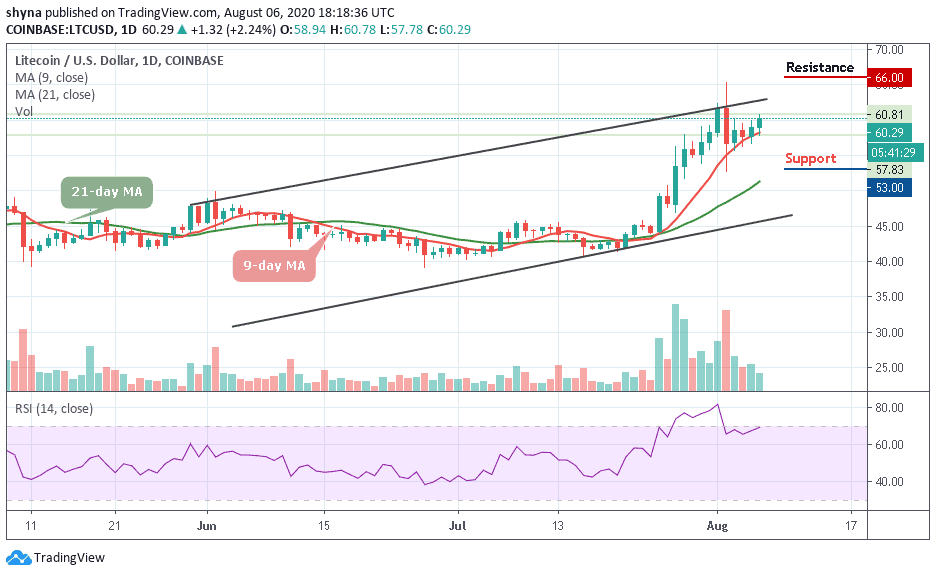
LTC/USD has gained over 2% since the beginning of the day to trade at $60.29. The seventh-largest coin has become one of the best-performing altcoins out of top-10 on a day-to-day basis. Currently, the coin’s total market value is registered at $3.81 billion, while its average daily trading volume is $2.07 billion.
What to Expect from Litecoin
On the daily chart, LTC/USD is initially supported by $57 below the 9-day moving average. However, once this barrier is broken, the sell-off may continue towards $55 and below the 21-day moving average. Meanwhile, if the price moves below $55, the sell-off is likely to continue with the next focus at $53, followed by $51 and $49 support levels.
On the upside, the market may need to see a sustainable move above the daily high at $60.81 for the upside to gain traction. The next resistance may now be created above the upper line of the ascending channel at $64 while the potential resistance could be located at $66, $68, and $70 respectively. The RSI (14) on the daily chart has reversed to the upside signaling that an extended recovery may be underway.
Against Bitcoin, the market has evolved for a while in a very different way. But currently, sellers and buyers are in a tug-of-war about who will dominate the market but the price is currently moving under the 9-day MA while the stochastic RSI is suggesting a bearish movement.
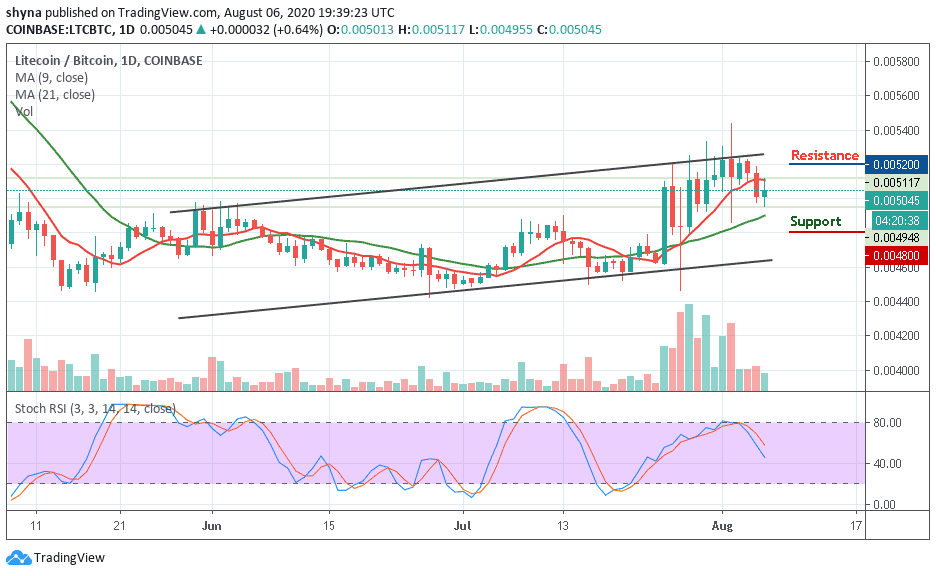
Looking at the daily chart, the bulls are making effort in building the confidence to increase their entries. More so, if the bulls succeed in the broken above the moving average, one would expect the market to reach the resistance level of 5200 SAT and 5400 SAT. Meanwhile, a retest could bring it to 4800 SAT and 4600 SAT support levels.
Join Our Telegram channel to stay up to date on breaking news coverage