Join Our Telegram channel to stay up to date on breaking news coverage
Bitcoin (BTC) Price Prediction – August 6
Bitcoin has recovered some of its dominance over the market in the past 24 hours after breaking above $11,700.
BTC/USD Long-term Trend: Bullish (Daily Chart)
Key levels:
Resistance Levels: $12,700, $12,900, $13,100
Support Levels: $10,800, $10,600, $10,400
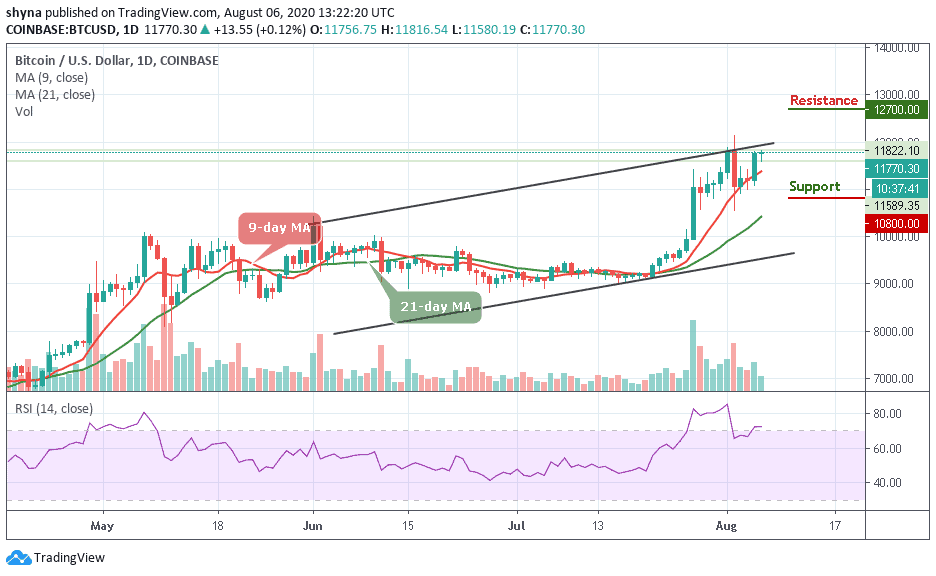
BTC/USD is having a fresh increase above the $11,700 level; the coin must surpass the $11,800 resistance zone to continue higher in the next few days. However, for BTC/USD to continue higher, it is important that the must retake and hold the $12,000 region. Although Bitcoin did face the nasty rejection slightly above $12,000 just hours ago, the bulls are still in control, trading above the 9-day and 21-day moving averages. As long as BTC/USD holds $11,000 on a daily chart, it is fair to say that the uptrend is still intact.
What Is the Next Direction for Bitcoin?
If Bitcoin begins a downside correction, it may likely fall below the $11,600 or $11,400. A downside break below the $11,200 and $11,000 support levels may likely open the doors for a larger decline towards the $10,800, $10,600, and $10,400 supports. On the upside, a successful daily close above the channel at $12,000 level could open the doors for a sharp increase above the $12,200 and $12,400 levels in the coming sessions. The next major resistance could be $12,700, $12,900, and $13,100.
BTC/USD Medium-Term Trend: Ranging (4H Chart)
On the 4-Hour chart, BTC/USD price hovers around $11,855 and if the bulls gather enough strength and regroup, the upward movement may be able to near the $12,300 and $12,500 resistance level.
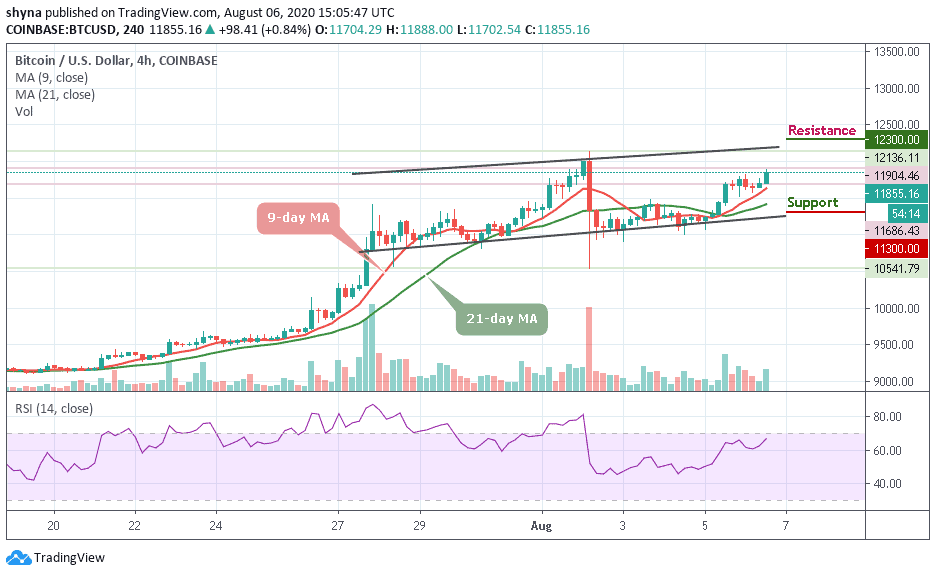
However, on the downside, immediate support is below the 9-day moving average at $11,500 while the main support is located at $11,300 level and below. Technically, Bitcoin is currently moving sideways while the RSI (14) moves below 70-level, indicating an indecisive in the market movement.
Join Our Telegram channel to stay up to date on breaking news coverage