Join Our Telegram channel to stay up to date on breaking news coverage
LTC Price Prediction – March 18
On March 13, the market valuation of LTC/USD went hiked to the north for a test of resistance point at the $240 mark. Shortly, the crypto lost momentum and, in the following session, price starts to retrace southward to find support around the $190 market level.
LTC/USD Market
Key Levels:
Resistance levels: $240, $260, $280
Support levels: $170, $150, $130
LTCUSD – Daily Chart
The bullish trend-line drawn has always been in helping to see a genuine trading-past scenario on the path of the 14-day SMA trading indicator. It has been showcasing a support-finding zone for a return of bullish moves in this crypto-economy. The 50-day SMA indicator is separated from the smaller SMA as they both point to the north. The Stochastic Oscillators are bent slantingly from the overbought region to seemingly begin to cross the hairs a bit above range 20. That signifies the potential of starting to see a return of an uptrend in this crypto-trade very soon.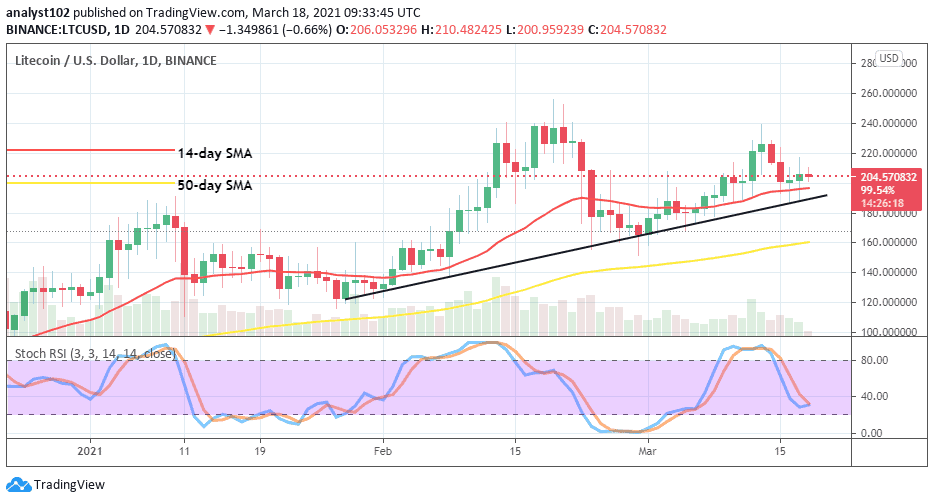
What could be the LTC/USD market’s next price direction?
Going by the present situation of the LTC/USD trading outlook, bulls are expected to mount more buying pressures as the price seems to have located support around the $190 level. However, the energy being exhibited by bulls appears to take the form of a lees-active moving mode. Therefore, there can be a line of smaller serial ups during attaining other high value.
On the downside, there has been no palatable trading spot to suggest a decent sell entry as of the time of writing. As a result, it is suggested that selling traders should put their activities on hold for a while until a bullish-retarding forces emerge against the violent further north journey of the ETH/USD trade. That said, The support level of $180 may serve as a testing-point during a fake bullish trend reversal move. 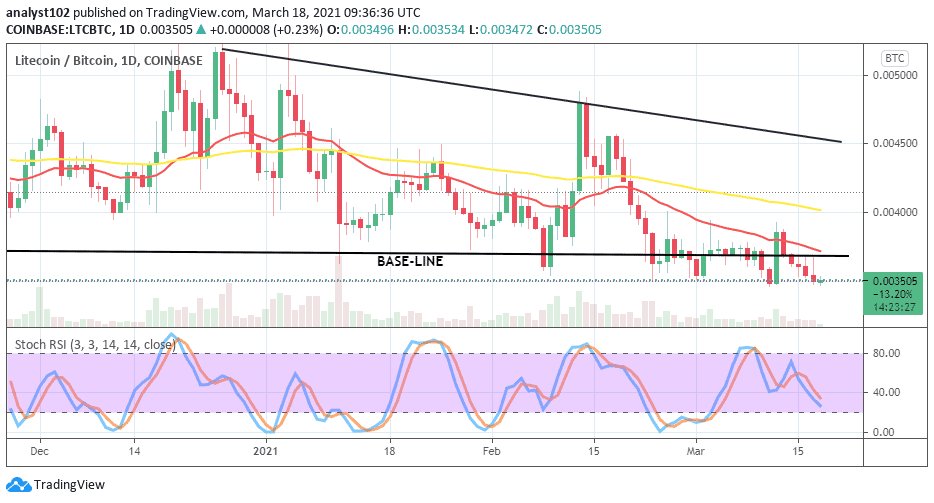
LTC/BTC Price Analysis
The LTC/BTC trading chart depicts that the base-crypto has consistently been plunged further southward below the base-line by the counter-crypto in comparison. That indicates that Bitcoin still carries more weight as paired with the value of Litecoin until the present. Both the two SMA trading indicators have attested to that by simply place above the market trading zone pointing towards the south. The Stochastic Oscillators are pointing towards the south a bit over range 20. That equally, indicates that the downward pressures are far from being over as regards the market trading worth between the LTC and the BTC.
Join Our Telegram channel to stay up to date on breaking news coverage