Join Our Telegram channel to stay up to date on breaking news coverage
Ethereum Price Prediction – March 18
The trading session on March 9 has appeared to be the current range-trading line of the ETH/USD. On March 13, a spike occurred to closely average a high-point of $2,000 but, the crypto couldn’t capitalize on that to push further in the north direction.
ETH/USD Market
Key Levels:
Resistance levels: $2,000, $2,200, $2,400
Support levels: $1,500, $1,300, $1.100
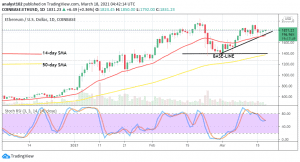
ETH/USD – Daily Chart
After a visible price rallying move from the base-line marked at $1,400 level, the crypto’s value has seemingly entered a range-bound trading mode around a high value of $1,800. The bullish trend-line is drawn to attest that the formation of current ranging moves is a result of leftover buying-spree caused by the ETH/USD bulls. The 14-day SMA trend-line is above the 50-day SMA closer to the current trading zone of the market. The Stochastic Oscillators have slantingly bent from the overbought region to place half-point between ranges 80 and 40. They attempt to close the hairs northbound in the ranges. That signals that buying pressure is in force to some extent.
Will ETH/USD price holds long the current short line of ranging trend?
The immediate resistance level of $2,000 will play a vital role in determining a new trend of the ETH/USD. In what sense, a breakout of it needs to come to play. Otherwise, price may continually tend to make failing efforts by facing series of rejection moves around the $1,800 and the $2,000 levels. Therefore, indecision trading conditions may at that capacity take the center stage of the crypto-market.
Taking the return of a sell-off trading situation of ETH/USD, bears will have to be fully patient until a violent bullish reversal move comes by. Alternatively, a sudden breakdown of the $1,800 point will give a lighter note to suggest a resumption of another round of correctional moves. Traders need to be wary of taking a sell position against a well-established bullish trend.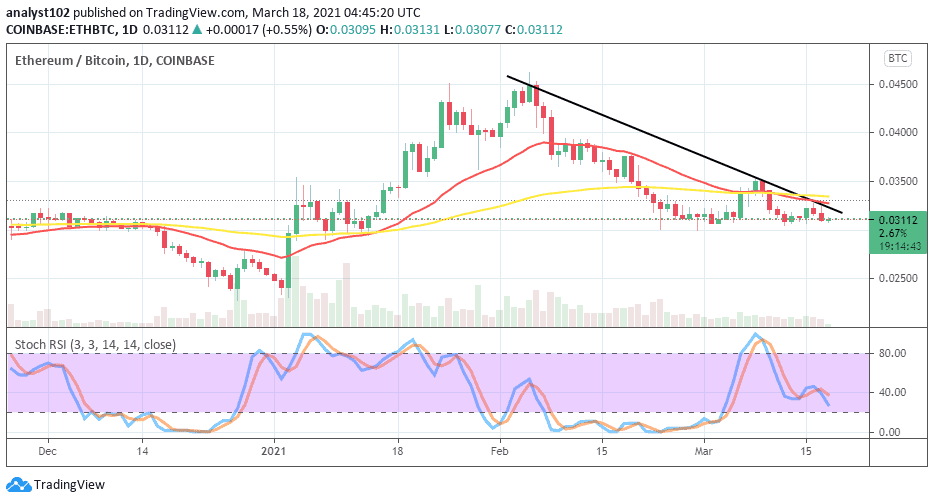
ETH/BTC Price Analysis
It is still apparent that market value throws weight behind BTC as the counter-crypto and, as paired the ETH as the base-crypto in the comparison. The 50-day SMA trend-line has been crossed from the top by the 14-day SMA trading indicator to the south. And, price trades closer underneath them to showcase the level of downward pressures. The Stochastic Oscillators are at range 40, with a slight opening of the hairs to point towards the south. That indicates that the falling forces against the ETH by the BTC have not been exhausted.
Join Our Telegram channel to stay up to date on breaking news coverage