Join Our Telegram channel to stay up to date on breaking news coverage
LTC Price Prediction – March 5
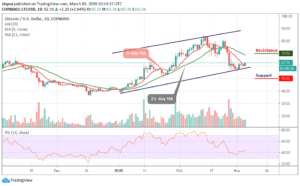
Litecoin (LTC) gains 3.64% in the last 24 hours to touch $63.40. It may find the next resistance at $65.
LTC/USD Market
Key Levels:
Resistance levels: $70, $75, $80
Support levels: $50, $45, $40

LTC/USD has exhibited strength over the last 24 hours but managed to regain some ground amid technical correction from the downward trend where it has traveled from $58 to $62. The coin has recovered from the sharp sell-off of yesterday. More so, the range of the price swings has been between $55 and $63. The overall gain of the day stands at 3.64%.
Moreover, though the current price of Litecoin at $62.56 is above the 9-day MA within the ascending channel, the recovery seems to have started as the technical indicator RSI (14) faces the north. The Litecoin (LTC) needs to continue its up-trending growth in the coming days to recover properly. As per the current trend, the next resistance level is likely at $70, $75 and $80.
On the downside, a sustainable move below the lower boundary of the channel could open up the way to a $55 support level and this barrier may likely slow down the bears and then serve as a jumping-off ground for the recovery. Meanwhile, the next support levels to watch for could be $50, $45 and $40.
Against Bitcoin, LTC continues to trend bearishly as the support further outweighs the resistance. In case of a trend reversal, there is a need for an increasing volume and resistance to cause an upsurge in the market. Now, the token is trading around the 6833 SAT below the moving averages. We can expect close support at the 6200 SAT and beyond.
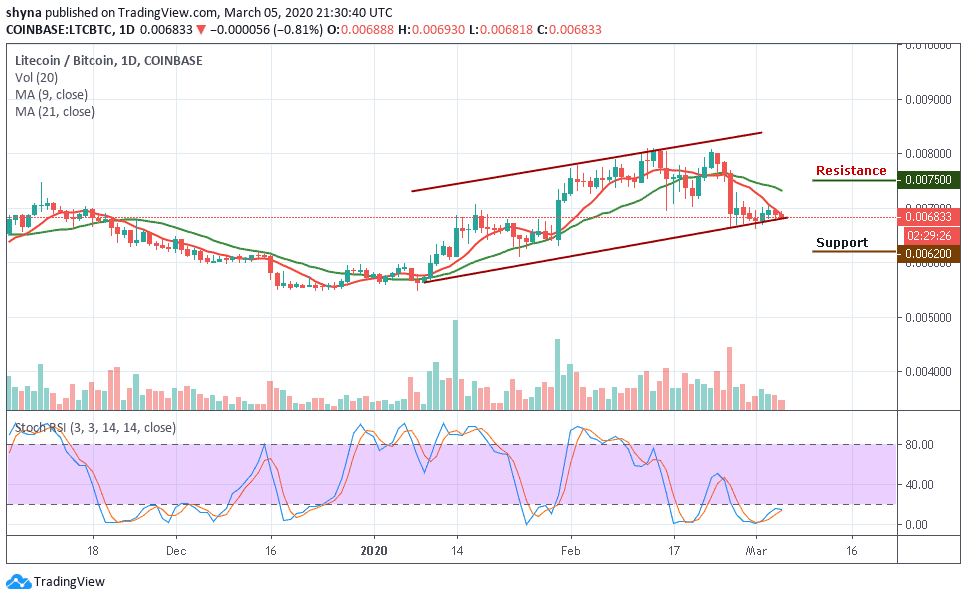
For now, there’s no sign of a bullish movement in the LTC market. However, if a bullish move occurs and validates a break significantly above the 9-day and 21-day moving averages to hit the nearest resistance at 7300 SAT; we can then confirm a bull-run for the LTC/BTC pair. More so, the closest resistance lies at 7500 SAT and 7700 SAT as the stochastic RSI is about leaving the oversold zone.
Please note: Insidebitcoins.com is not a financial advisor. Do your research before investing your funds in any financial asset or presented product or event. We are not responsible for your investing results.
Join Our Telegram channel to stay up to date on breaking news coverage