Join Our Telegram channel to stay up to date on breaking news coverage
XRP Price Prediction – March 5
Ripple (XRP) crosses and break the resistance at $0.240 as the price saw a 2.51% increase over the past 24 hours of trading.
XRP/USD Market
Key Levels:
Resistance levels: $0.270, $0.280, $0.290
Support levels: $0.200, $0.190, $0.180
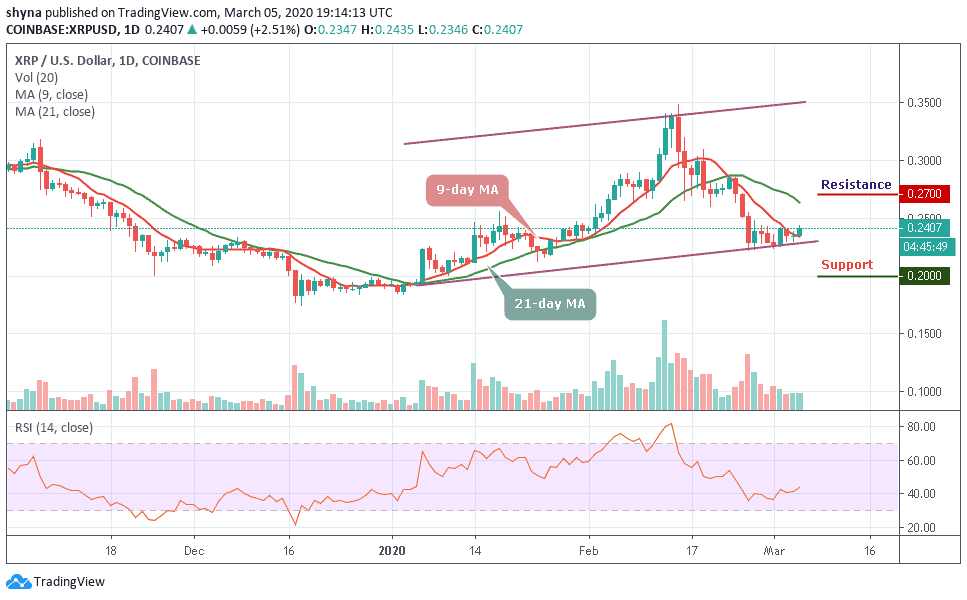
XRP/USD struggles to settle above $0.240 amid global recovery on the cryptocurrency market. The third-largest digital asset has gained nearly 2.52% in the recent 24 hours and touched the intraday high at $0.244 before retreating to $0.238. A few weeks ago, XRP/USD had previously dropped by around 36% after the cryptocurrency failed to overcome resistance at the $0.35 level which caused it to roll over and fall.
Taking a look at the daily chart above, we can see that it has now been trading within a range between this support, $0.225, and the resistance at $0.240. More so, as the technical indicator RSI (14) moves above 43-level, a breakout of this range could dictate in which direction XRP/USD may be heading toward next. If the price collapses beneath the range, XRP/USD may turn bearish and a break above this range could start to put the Ripple (XRP) back on the bullish footing.
Moreover, XRP needs to break the current range for it to break out of the neutral trading condition. If the buyers can break above the 9-day moving average at $0.250, the first level of resistance lies at $0.255 level. Any further movement above this, the potential resistance lies at $0.270, $0.280 and $0.290 levels. On the downside, the support at $0.226 should hold moving forward. If the market pushes beneath here, the market will turn bearish and further support levels could be reached at $0.200, $0.190 and $0.180 respectively.
When compares with BTC, XRP is moving at the downside of the channel. Meanwhile, the price action has remained intact within the channel and if the selling pressure continues, the XRP/BTC price variation may create a new monthly low. At the moment, the signal line of RSI (14) faces the downside; we may continue to see a negative move in the market as much as the coin continues to trade below the moving averages.
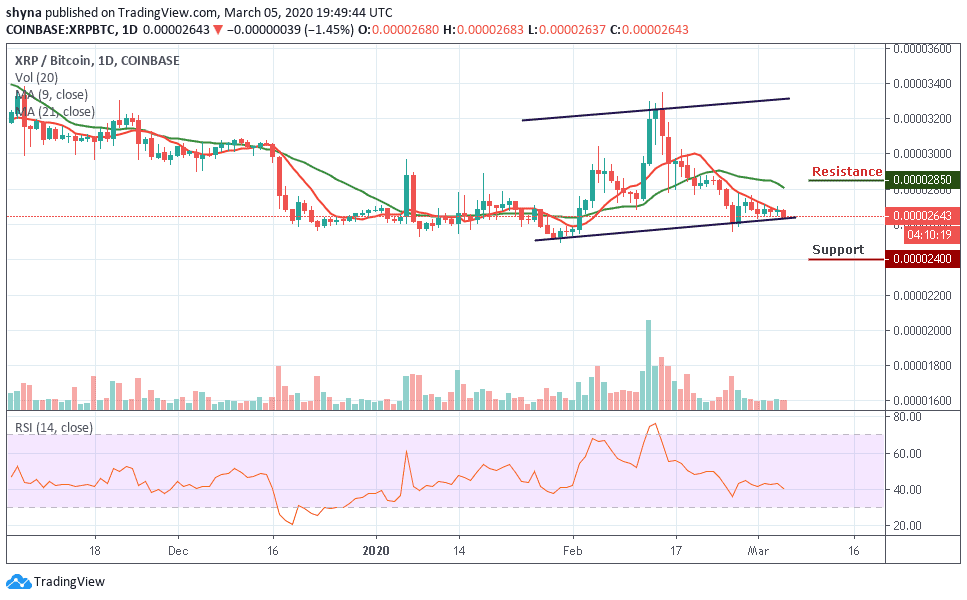
However, as the daily chart reveals, XRP/BTC is currently moving at 2643 SAT which is around the lower boundary of the channel. Traders may expect close support at 2400 SAT before breaking to 2300 SAT and critically 2200 SAT levels. Should in case a bullish movement occurs and validates a break above the 9-day moving average; we can then confirm a bullish movement for the market and the nearest resistance levels to reach lies at 2850 SAT and above.
Please note: Insidebitcoins.com is not a financial advisor. Do your research before investing your funds in any financial asset or presented product or event. We are not responsible for your investing results.
Join Our Telegram channel to stay up to date on breaking news coverage