Join Our Telegram channel to stay up to date on breaking news coverage
LTC Price Prediction – May 17
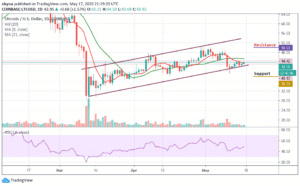
LTC/USD is currently changing hands at $43.95 as the technical indicator moves above the 45-level.
LTC/USD Market
Key Levels:
Resistance levels: $50, $52, $54
Support levels: $38, $36, $34

LTC/USD is trading in the green in today’s session; the coin is seen trading above the 9-day moving average where the coin has gained over 1.57%. The Litecoin bulls broke out from a bearish formation and start moving upward but the price action is capped to the upside at $43 and supported the downside at $42, within tight conditions.
Moreover, a couple of days ago, Litecoin (LTC) price was trapped in an incredible downward movement after the bullish rally failed to materialize several times. LTC/USD has failed to break out towards the resistance level of $45. Instead, the bears are trying to force their way back to the $42 support level.
However, a break below the $40 support level may provoke an even deeper decline towards the $38, $36 and $34 support levels. Looking at the RSI (14), the Litecoin price has found its way to the upside, indicating that the bulls may continue to push the coin towards the north, then the price may likely hit the resistance levels of $50, $52 and $54 respectively.
When compares with BTC, LTC continues to trend bearishly as the support further outweighs the resistance. In case of a trend reversal, there is a need for an increasing volume and resistance to cause an upsurge in the market. Now, the coin is trading around the 4509 SAT below the moving averages. We can expect close support at the 4000 SAT and beyond.
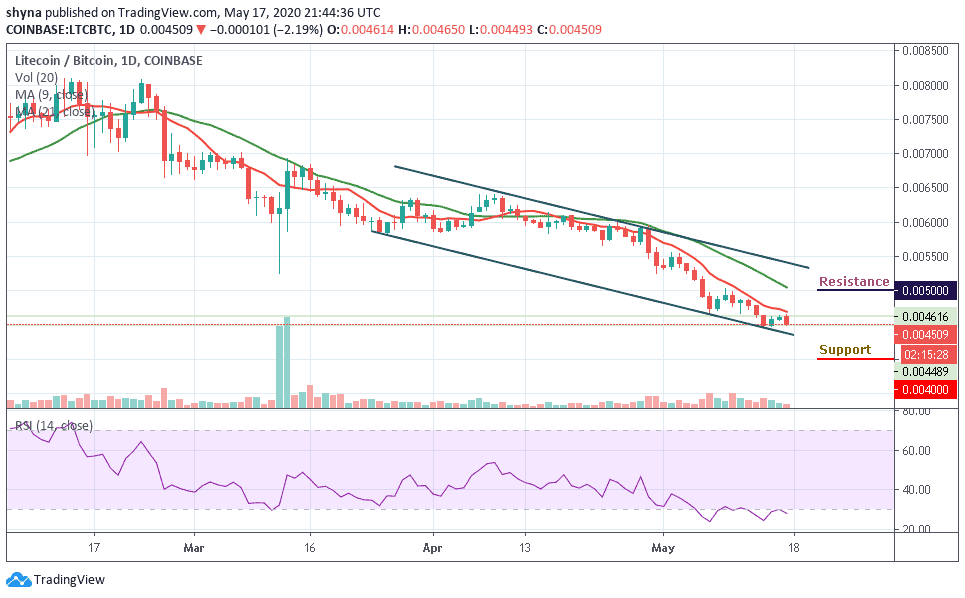
For now, there’s no sign of a bullish movement in the LTC market. However, if a bullish move occurs and validates a break significantly above the 9-day and 21-day moving averages to hit the nearest resistance at 4800 SAT; we can then confirm a bull-run for the LTC/BTC pair. More so, the closest resistance lies at 5000 SAT and 5200 SAT as the RSI (14) stays within the oversold zone.
Please note: Insidebitcoins.com is not a financial advisor. Do your research before investing your funds in any financial asset or presented product or event. We are not responsible for your investing results.
Join Our Telegram channel to stay up to date on breaking news coverage