Join Our Telegram channel to stay up to date on breaking news coverage
Litecoin Portrays a Recovery – August 29
There has been mustering of energy in the LTC/USD market activities about two days ago as the crypto portrays a recovery trading outlook against the US Dollar. The financial book of records in the last seven days has that the price has witnessed a low and a high of 52.12 and 57.96 value lines. As of the time of writing, the market bargain point is at $55.87 at an average positive percentage rate of 4.64.
Litecoin (LTC) Statistics:
LTC price now – $55.87
LTC market cap – $4 billion
LTC circulating supply – 71.1 million
LTC total supply – 84 million
Coinmarketcap ranking – #21
LTC Trade
Key Levels:
Resistance levels: $70, $80, $90
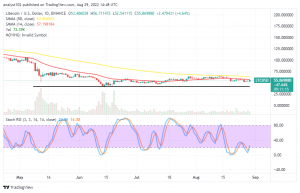
Support levels: $50, $40, $30 LTC/USD – Daily Chart
The LTC/USD daily chart showcases the crypto market portrays a recovery movement, trading against the valuation of the US currency. The 14-day SMA indicator is at $57.20 beneath the $63.51point of the 50-day SMA indicator. The horizontal line drew at $42 below the SMA trend lines, showing the close lower-end that the price had initially fallen to in the past. The Stochastic Oscillators are between the 40 range and the oversold region as they position, trying to point northbound at 14.30 and 24.96 range values.
Your capital is at risk.
Which direction is by now worthy of focusing on in the LTC/USD market operations?
The downward slow-and-steady correction motions have seemingly reached a logical conclusion to now allow the LTC/USD market buyers to make a come-back as the crypto market portrays a recovery motion presently. In the meantime, some pull-downs may surface toward the previous low value at the $42 horizontal line drawn will purposely let the market re-garner momentum swing back upward. Therefore, long-position placers are alert when that presumption analytics have to play out to take advantage.
On the downside of the technical analysis, it is apparent to some extent that gravity to the downside tends to be lowly-active to create panic sell-offs in the process. Based on that, short-position placers may have to put their re-launching of selling orders on hold for a while. Selling activities may resume after the market pushes to test resistance around the 50-day SMA for rejections. And that may run into some sessions.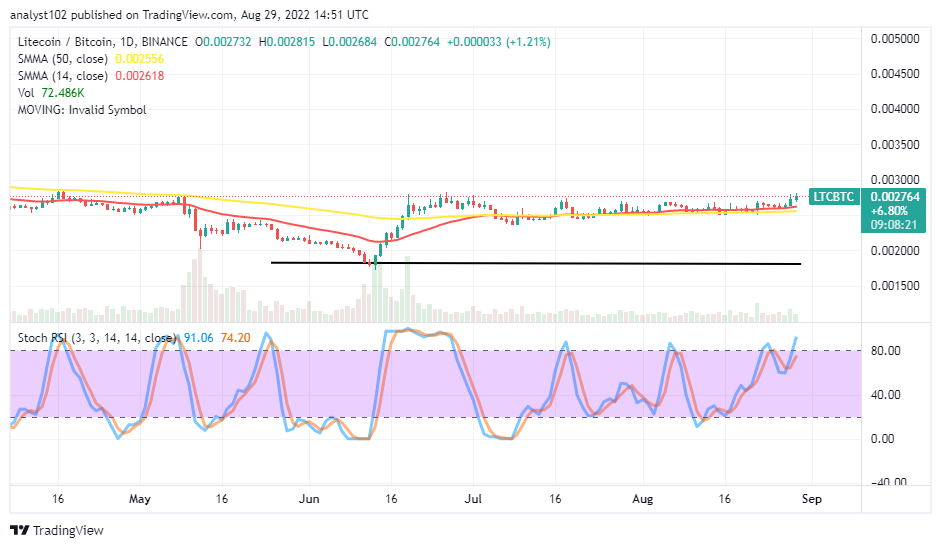
LTC/BTC Price Analysis
Litecoin has continually held higher in a range around the conjoined trending lines of the SMAs. A bullish candlestick has surfaced from the SMAs, putting the former trading tool on a better hedge of surging more for ups, pairing with the latter crypto. Over several sessions back, the 14-day SMA indicator moved northward to join the 50-day SMA indicator. The Stochastic Oscillators have crossed northbound, partially maintaining 74.20 and 91.06 range values. That shows the base crypto may still push for some ups to make completion against its weaknesses of the counter-trading crypto before relaxing afterward.
Read more:
Join Our Telegram channel to stay up to date on breaking news coverage