Join Our Telegram channel to stay up to date on breaking news coverage
Litecoin Suffers Slow Precipitations – August 22
Recently, there has been a correction in the LTC/USD market as the crypto economy shows below the trend lines of the SMAs. The last thirty days’ sessions have witnessed low and high points at $52.20 and $65.63.
Litecoin (LTC) Statistics:
LTC price now – $55.04
LTC market cap – $3.9 billion
LTC circulating supply – 70.9 million
LTC total supply – 84 million
Coinmarketcap ranking – #21
LTC Suffers Slow Precipitations
Key Levels:
Resistance levels: $70, $80, $90
Support levels: $50, $40, $30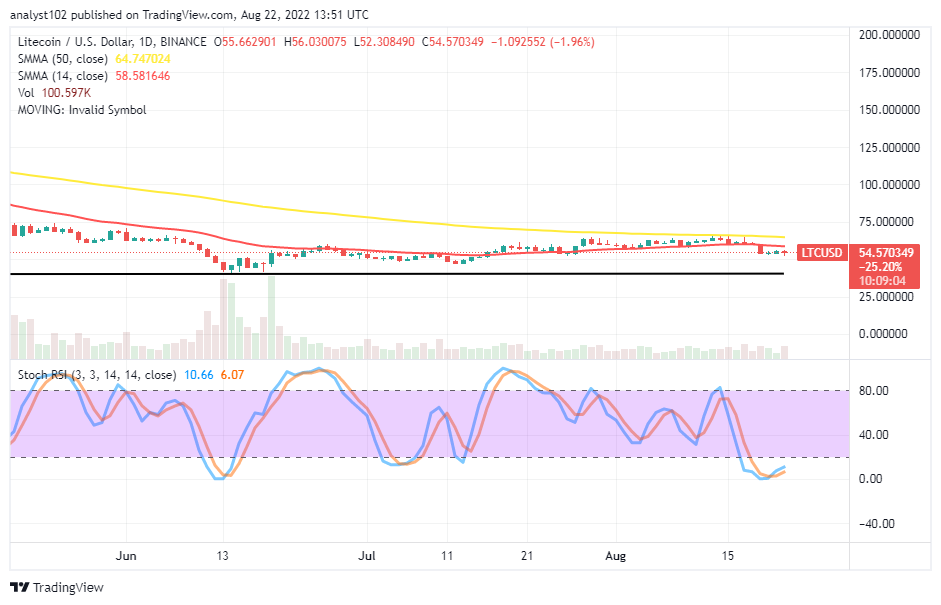 LTC/USD – Daily Chart
The LTC/USD daily chart showcases the crypto economy shows below the trend lines of the SMAs. The 14-day SMA indicator is at $58.581646 underneath the 50-day SMA indicator, which is at $64.747024. The horizontal baseline drew at the $40 support level. The Stochastic Oscillators have dipped into the oversold region, maintaining 10.66 and 6.07 range points within. A line of three candlesticks formed beneath the smaller SMA affirms the present trading outlook.
Your capital is at risk.
Will the LTC/USD market succumb further to a depression beneath the SMAs’ trend lines?
In the wake of trying to intensify the declining force, the LTC/USD market tends to surrender to a further depression underneath the trend lines of the SMAs as the crypto’s price shows below them presently. However, a slow-and-steady moving motion may produce a gradual move toward touching the $40 support level, in the long run, to allow a buying set-up around the zone afterward.
On the downside of the technical analysis, sellers are not likely to get sustainable re-launching of shorting orders if the price has to rebound against the value line of the 14-day SMA at $58.581646. As the trading situation currently portends, a less active-moving force may achieve, at a higher risk than letting off the trade, for now, to allow a decent pattern to take a reform afterward.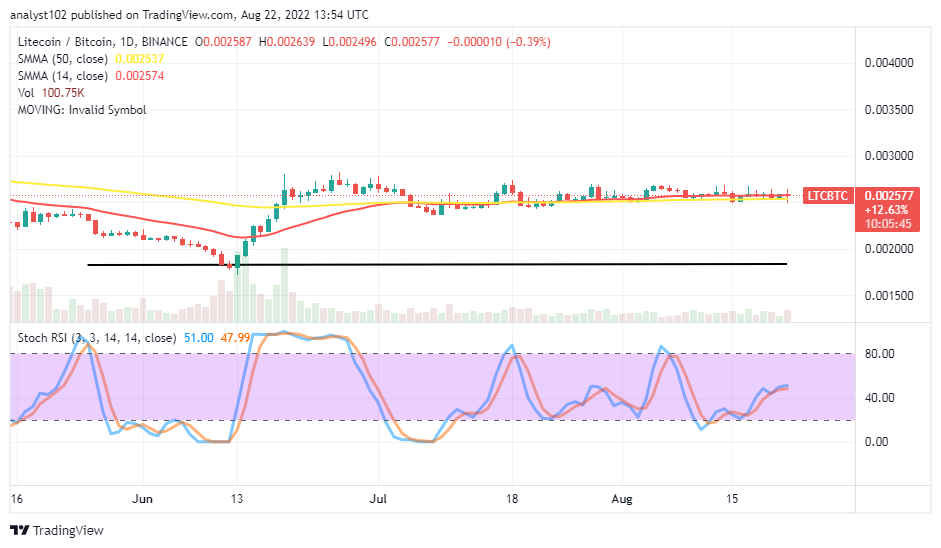
LTC/BTC Price Analysis
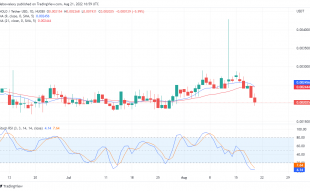
Litecoin has maintained a perfect sideways movement at a higher-trading zone, involving the trend lines of the SMAs. In another way round, the cryptocurrency pair price shows below some higher points that it has been rejected recently above the trend lines of the SMAs. Over a couple of sessions, the 14-day SMA indicator has kept trending eastward alongside the 50-day SMA indicator to indicate that a degree of ranging motion plays out in the pairing instrument. The Stochastic Oscillators are around 51 and 47.99 range values, slightly swerving northbound. It shows that base crypto is struggling to gain momentum against its counter-trading crypto.
Read more:
Join Our Telegram channel to stay up to date on breaking news coverage