Join Our Telegram channel to stay up to date on breaking news coverage
LTC Price Prediction – January 13
LTC/USD may likely settle in a range between $48 and $50 as the stochastic RSI moves in the same direction within the overbought zone.
LTC/USD Market
Key Levels:
Resistance levels: $57, $59, $61
Support levels: $43, $41, $39
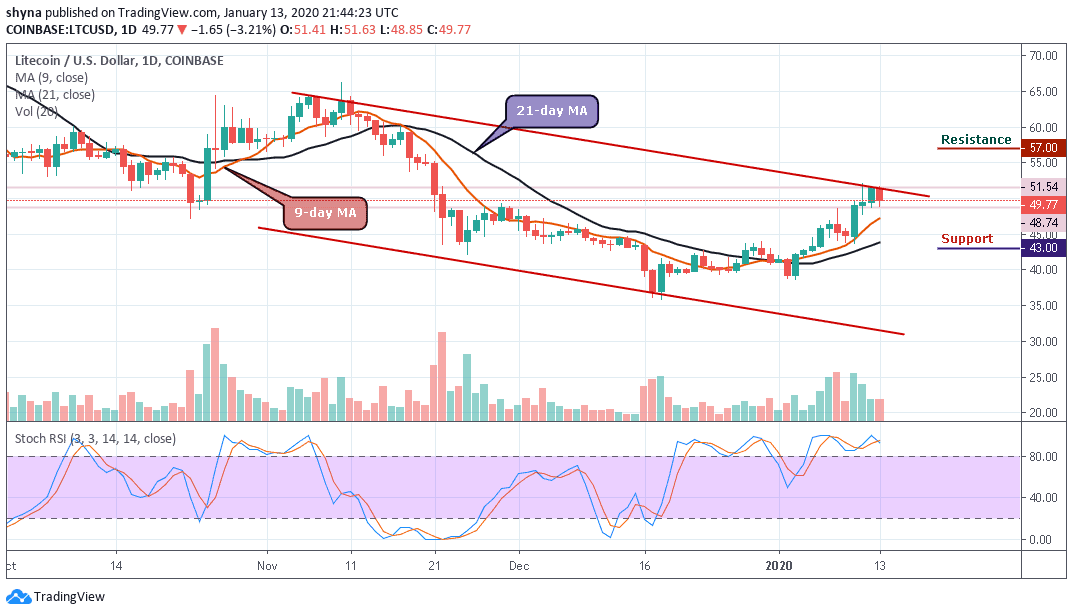
LTC/USD is still moving below the upper boundary of the ascending channel after a bullish rally failed to materialize. In fact, the cryptocurrency is trading in its tightest two weeks trading band after the bulls took over from the bears. Today, an early trading session towards the $52 level failed to generate sustainable gains, with the LTC/USD pair slipping back under the $50 level.
However, the longer the pair fails to rally from current trading levels, the greater the chance that we may see the cryptocurrency falling below the moving averages. A break below the $45 support level may provoke an even deeper decline towards the $43, $41 and $39 levels. Meanwhile, the short-term technical analysis shows that the $51 and $53 levels are currently the strongest forms of technical support before the $55 level starts to come back into focus.
Clearly, the great idea of investing with the help of cfd brokers could possibly never go wrong. Check out these bitcoin price trackers for the latest trend.
Moreover, the daily chart reveals that the LTC/USD needs to break the technical region of the $53 level which is above the upper boundary of the ascending channel. Since the 9-day MA is moving above the 21-day MA, the coin may likely reach the resistance levels of $57, $59 and $61. Meanwhile, the stochastic RSI is extremely within the overbought zone, which indicates more bullish signals are in focus.
Against Bitcoin, the daily chart has shown that the bulls are dominating the market with a heavy upsurge as the price moves above the moving averages of 9-day and 21-day. Meanwhile, if the bulls could put more effort to break out of the ascending channel, the key resistance levels lie at 0.0063 BTC and 0.0064 BTC. A further rise may push the price to 0.0066 BTC and above.
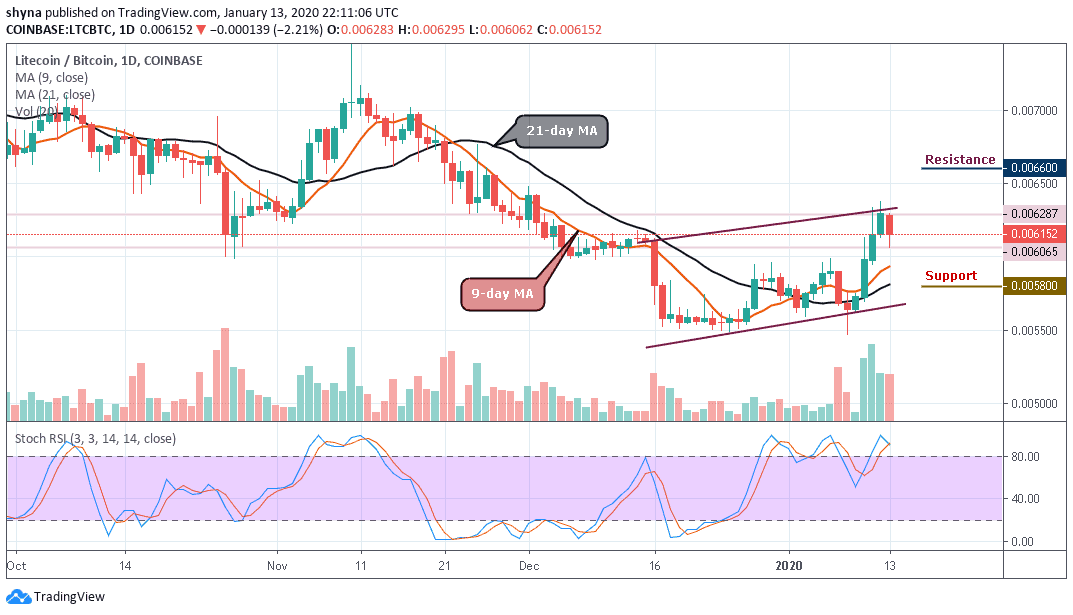
In other words, for a reversal, the 0.0060 BTC support may likely resurface and if the 0.0060 BTC couldn’t hold the support, the price may further drop to 0.0058 BTC, 0.0056 BTC, and 0.0054 BTC support levels while the stochastic RSI keeps swimming in the overbought zone.
Please note: Insidebitcoins.com is not a financial advisor. Do your research before investing your funds in any financial asset or presented product or event. We are not responsible for your investing results.
Join Our Telegram channel to stay up to date on breaking news coverage