Join Our Telegram channel to stay up to date on breaking news coverage
Bitcoin (BTC) Price Prediction – January 13
Bitcoin price is trading nicely above the $8,000 and the coin must climb above the $8,500 resistance to continue higher.
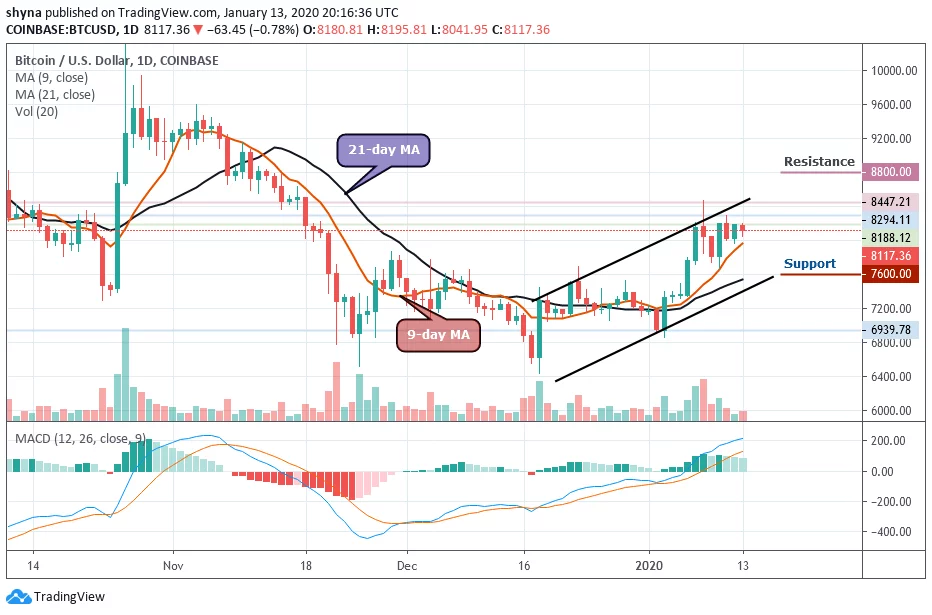
BTC/USD Long-term Trend: Bullish (Daily Chart)
Key levels:
Resistance Levels: $8,800, $9,000, $9,200
Support Levels: $7,600, $7,400, $7,200
BTC/USD started the day with a downside movement as many coins started moving the same direction as well, but later, the Bitcoin market started improving. Within the first few days of the first month of the first quarter, BTC/USD has moved up from $6,939.78 to $8.447.21 and now changing hands at $8,117.36.
More so, BTC/USD is struggling to climb higher above the $8,500 resistance as the coin is settling in a tight range between $7,800 and $8,200 above the 9-day and 21-day moving averages. Typically when the new uptrend movements are beginning to form, buyers will use the moving averages as the nearest support levels. But in as much as the orange-line of 9-day MA is above the black-line of 21-day MA, the market could still remain in the upward movement.
Moreover, if the market decides to go down, Bitcoin’s price may drop to $7,800 and should this support fails to contain the sell-off, we may see a further drop to $7,600, $7,400 and critically $7,200. The resistance levels to watch are $8,800, $9,000 and $9,200 respectively. Meanwhile, the MACD signal lines have already crossed into the positive side, suggesting more bullish signals.
BTC/USD Medium-Term Trend: Bullish (4H Chart)
Looking at the 4-hour chart, the bears have been dominating the market for the past few days now, but the bulls are trying to step back into the market to defend the $8,000 support. If not, the $8,000 and below may come into play.
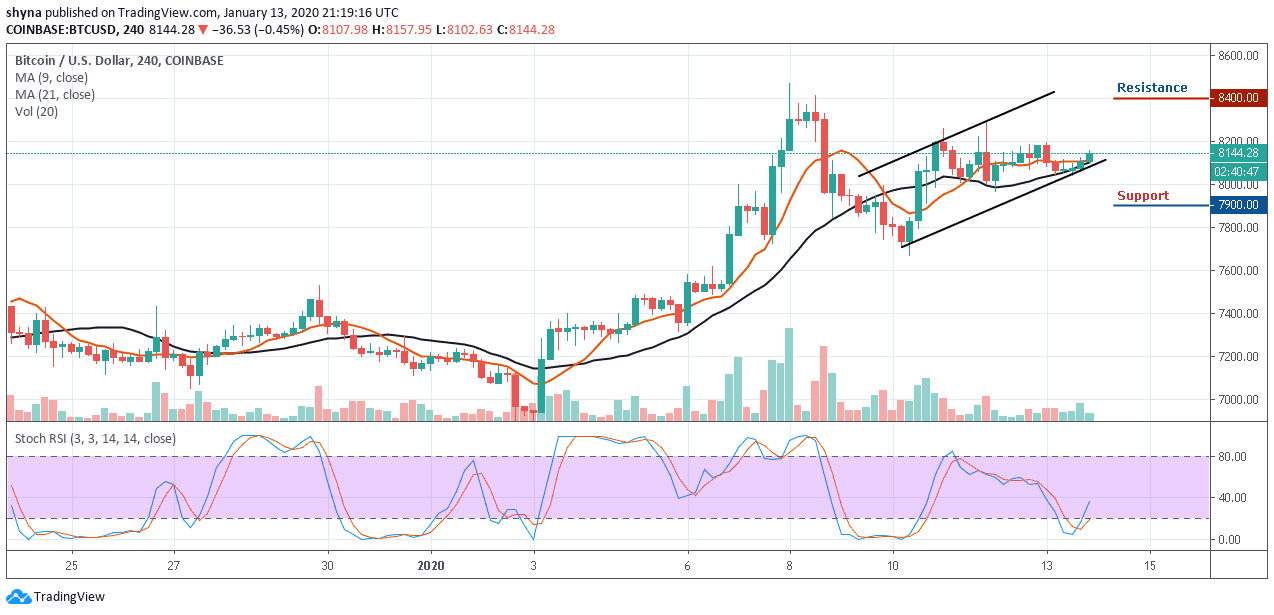
However, if the bulls can reinforce and power the market, traders may expect a retest at $8,200 resistance level and breaking this level may further push the price towards the resistance level of $8,400 and above. The stochastic RSI has just recovered from the oversold zone, now moving towards the 40-level.
Please note: Insidebitcoins.com is not a financial advisor. Do your research before investing your funds in any financial asset or presented product or event. We are not responsible for your investing results.
Join Our Telegram channel to stay up to date on breaking news coverage