Join Our Telegram channel to stay up to date on breaking news coverage
Litecoin (LTC) Price Prediction – October 26, 2020
LTC/USD rebounded above the $47 low as price rallied to $60 high. The upward move is likely to continue on the upside. The LTC/BTC has been in a downward move. The bulls made an upward correction on the upside but the uptrend was short-lived. The selling pressure is likely to continue.
LTC/USD Market
Key Levels:
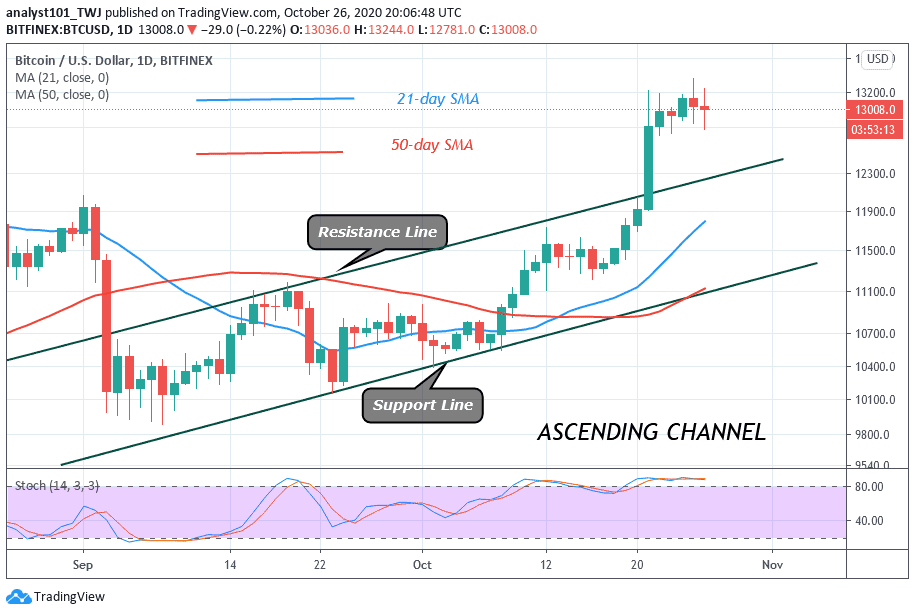
Resistance Levels: $80, $100, $120
Support Levels: $50, $40, $20

Yesterday, the coin rebounded as it reached the recent high of $60. The current uptrend has made Litecoin bulls to breach the crucial resistance levels of the market. That is the bulls have
broken the price levels of $48 and $51 which have become an impediment to initial resistance to price movement. With the recent rebounds, there is a certainty of price movement on the upside.
If the current momentum is sustained LTC is expected to reach a high of $63. Despite the initial success by the bulls, sellers may want to interrupt price movement at the resistance zones. However, if the bulls turn from the recent high and price retraces below the $50 low, the coin will fall into the bearish trend zone. This in effect will increase the chances of a further downward move. The coin will drop again to $43 low.
Litecoin Indicator Analysis
The price bars are above the SMAs. This suggests the upward movement of the coin. The moving averages have made a bullish crossover as the 21-day SMA crosses above the 50-day SMA. LTC is presently above the 80% range of the daily stochastic. The coin is trading in the overbought region of the market. Sellers may emerge to push prices downward.
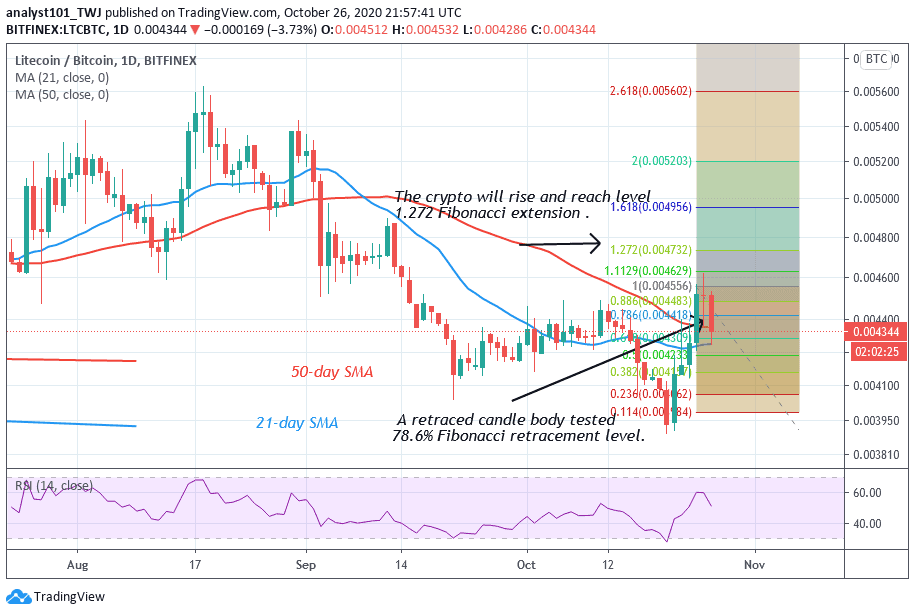
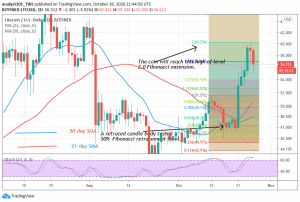
On the LTC/BTC chart, the coin has been on a downward move. On October 21 uptrend, the retraced candle body tested the 78.6% Fibonacci retracement level. This indicates that the crypto will rise and reach level 1.272 Fibonacci extensions. in other words, the crypto will reach the high of Ƀ0.004732. The Relative Strength Index of the coin is at level 51. It indicates that there is a balance between supply and demand.
Join Our Telegram channel to stay up to date on breaking news coverage