Join Our Telegram channel to stay up to date on breaking news coverage
Bitcoin (BTC) Price Prediction – October 26, 2020
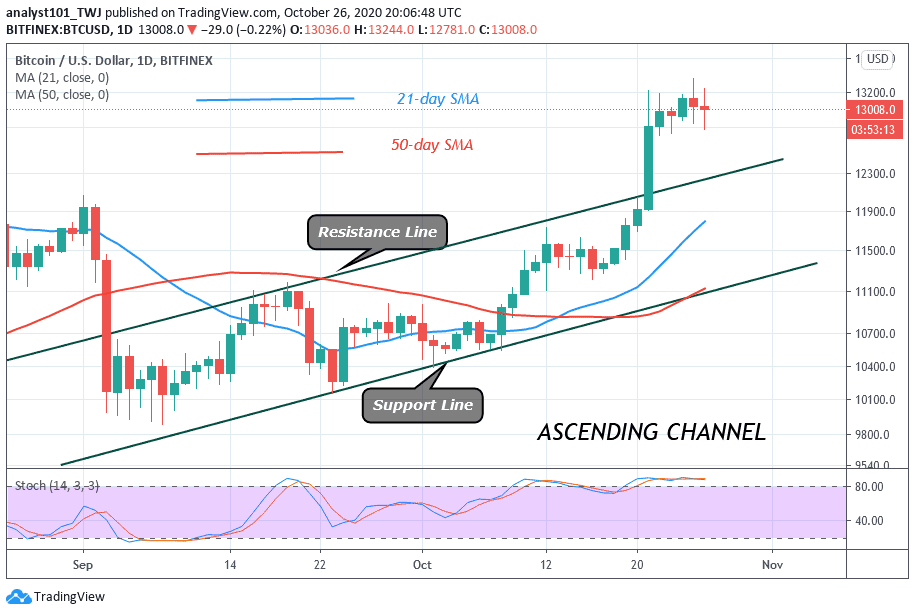
Today, BTC/USD price retested the $13,200 resistance and it plunged to a $12,800 Low. Bitcoin has been confined between levels of $12,800 and $13,200 for about a week. The upward move has been hindered because of intense selling pressure at the $13,200 high.
Resistance Levels: $13,000, $14,000, $15,000
Support Levels: $7,000, $6,000, $5,000

Following the stoppage of the current uptrend at the recent high, buyers have been making frantic efforts to break the current resistance and resume the upward move. Today, the bulls buy the dips after price plunged to $12,.800. The bulls have earlier made attempts to break the resistance at $13,200 but were repelled. However, in the first attempt on October 25, the bulls broke the overhead resistance but could not sustain the upward move.
The market will reach a high of $14,000 once the overhead resistance is breached. On the other hand, if the bears break below $12,800, the market will drop to the $12,460 low. In a situation where e the range-bound levels remain unbroken, Bitcoin will consolidate for a few more days. Bitcoin is still trading above the 80% range of the daily stochastic. BTC is trading in the overbought region of the market.
The Number of Bitcoin Whales Increase During Last Week Price Surge
Because of the recent price surge, the number of Bitcoin whales has continued to increase. According to BitcoinCharts: On October 20, 2,178 Bitcoin addresses held at least 1,000 BTC. Similarly, on October 25, this number increased to 2,231. This 1,000 BTC will translate to approximately $13 million at the price levels. According to reports these whale addresses control a much higher 7,902,469 BTC, or 42% of the total supply.

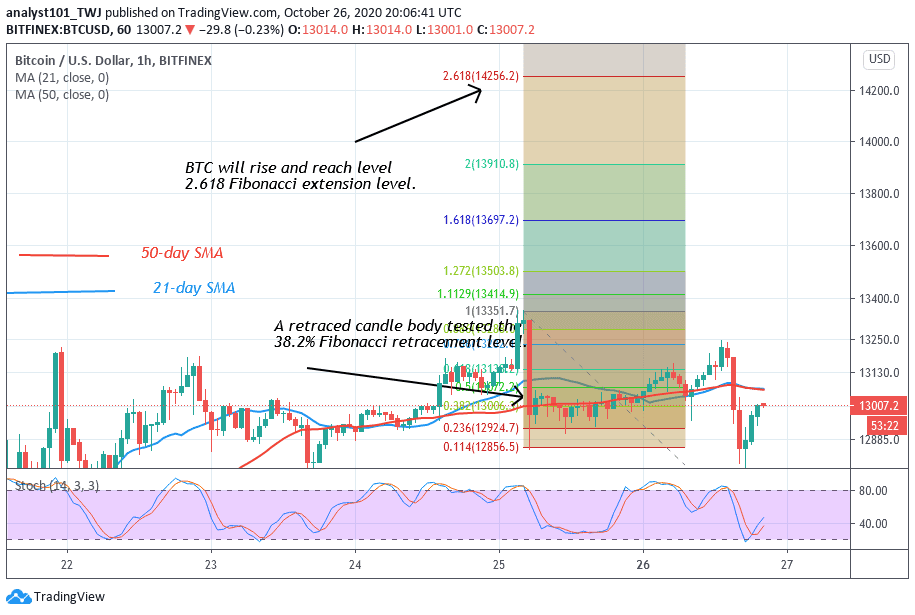
Bitcoin is range-bound between levels $12,800 and $13,200. On October 25 uptrend, BTC was resisted at $13,358 high. The retraced candle body tested the 38.2 % Fibonacci retracement level. This indicates that Bitcoin will rise and reached level 2.618 Fibonacci extension level. In the other words, the high of $14,256.20.
Join Our Telegram channel to stay up to date on breaking news coverage

