Join Our Telegram channel to stay up to date on breaking news coverage
BCH Price Prediction – October 26
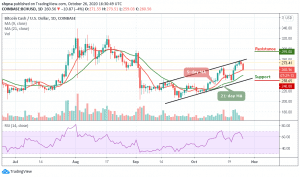
The Bitcoin Cash (BCH) retreats to test $255 support below the 9-day moving average.
BCH/USD Market
Key Levels:
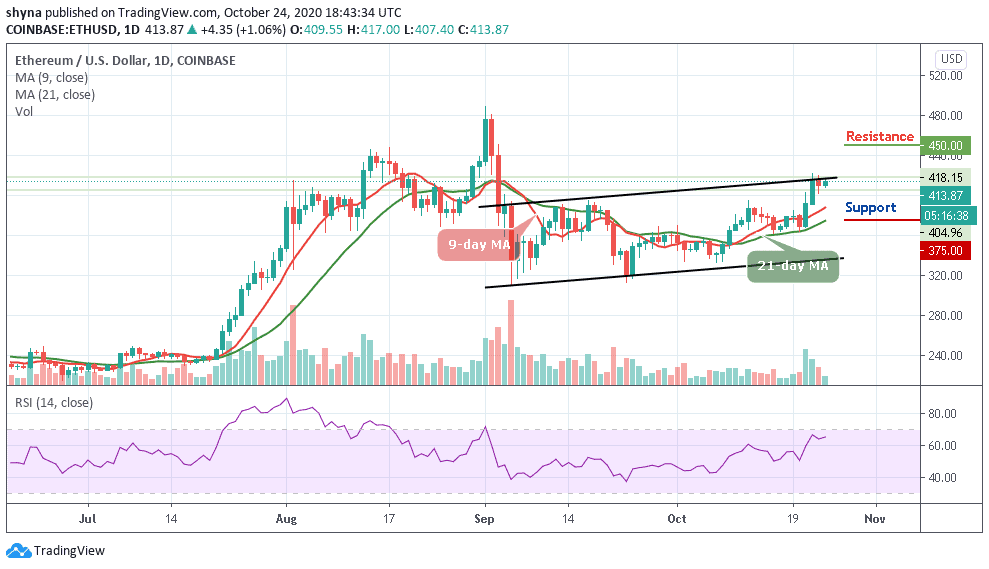
Resistance levels: $295, $305, $315
Support levels: $240, $230, $220

At the time of writing, BCH/USD is looking to slow down and settle around the $260 level. The market is breaking down towards the 21-day moving average, touching its lowest daily level at $255.77. The current performance of the coin in the market is below the normal expectations of traders and the coin may continue to follow the downtrend according to the technical indicator.
Where is BCH Price Going Next?
BCH/USD is currently trading at $260.56; the daily chart shows that the coin is trading around the 9-day moving average within the ascending channel. At the time of writing, the market price could not cross above the upper boundary of the channel before issuing a sell signal as the RSI (14) moves below the 60-level.
However, a minimum swing below the 21-day moving average may likely bring the coin to a $245 support level. Exceeding this level could take the bears to $240, $230, and $220 levels. In other words, a high swing above the channel may likely take the bulls to a key resistance level of $285. Above this, the coin can possibly trigger a bullish rally which may take the price to $295, $305, and $315 resistance levels.
When compares with Bitcoin, the last few days has been giving the bears an upper hand in controlling the market. Following the recent negative sign on yesterday and today, BCH/BTC may continue to follow the downward trend in as much as the sellers keep on pumping more pressure into the market.

Moreover, the market price may likely resume an upward trend if the bulls can hold the price at the 1997 SAT and then cross above the 9-day and 21-day moving averages to hit the resistance level of 2150 SAT and above. However, as the RSI (14) moves below 40-level, a retest could lower the price of the coin to the supports of the 1900 SAT and below.
Join Our Telegram channel to stay up to date on breaking news coverage