Join Our Telegram channel to stay up to date on breaking news coverage
LTC Price Prediction – October 26
Today, LTC/USD is seen moving downward after touching the monthly high of $59.99.
LTC/USD Market
Key Levels:
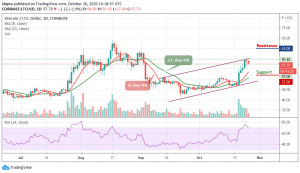
Resistance levels: $65, $67, $69
Support levels: $52, $50, $48

At market opening today, after touching the daily high at $59.35, LTC/USD price is seen following a bearish movement towards the 9-day and 21-day moving averages. However, peradventure the Litecoin (LTC) improves within the last hours of the day; the intraday traders may expect a positive close. But for now, most of the top cryptocurrencies are under tremendous selling pressure as they are all facing the south.
What to Expect from Litecoin (LTC)
The Litecoin is on the verge of sliding again if it falls beneath the support at $41. It would need to fall further beneath $55. If the sellers do push Litecoin beneath the mentioned-support, provided by the short term, traders may expect additional support at $53. This may then be followed with added supports at $52, $50, and $48 below the 9-day and 21-day moving averages.
On the upside, the resistance lies at $60 and $62 which is above the moving averages, higher resistance lies at $65, $67, and $69. The technical indicator RSI (14) is seen leaving the overbought region which may be bad news to the investors as it shows that the sellers may be stepping back into the market. Therefore, for any bullish movement, the technical indicator would need to climb back into the overbought zone to take control again.
Against BTC, LTC is currently following a downward trend, as the coin recently exploded under the solid support of 4400 SAT and continued to fall below 4300 SAT. The critical support level is located below the 9-day moving average at level 4100 SAT and below as the RSI (14) moves below 60-level.

However, if the bulls continue to power the market, the coin may likely cross above the upper boundary of the channel to reach the potential resistance level at 4700 SAT and above. Meanwhile, at the time of writing, the price of Litecoin is currently changing hands to 4331 SAT.
Join Our Telegram channel to stay up to date on breaking news coverage