Join Our Telegram channel to stay up to date on breaking news coverage
Litecoin (LTC) Price Prediction – August September 4, 2020
LTC/USD price is trading at $51 after the recent breakdown. The previous uptrend has been invalidated as the coin resumed downtrend. In the LTC/BTC, the market is in a sideways trend, the coin is fluctuating in a confined range.
LTC/USD Market
Key Levels:
Resistance Levels: $80, $100, $120
Support Levels: $50, $40, $20

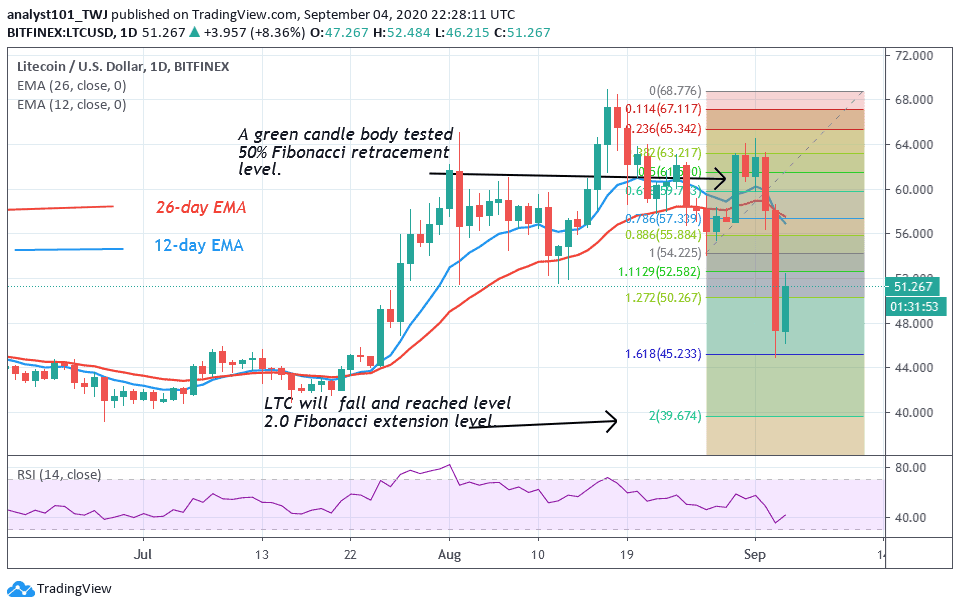
Before the recent breakdown, buyers have been making frantic efforts to push the coin above the previous highs. One of such attempts is the August 30 bullish run. LTC rebounded above $57 as the coin rallied to $64 high. Despite the rebound, buyers could not break above the $64 resistance. Litecoin encountered a bearish reaction as LTC declined to $48 low. Nevertheless, the selling pressure of Litecoin may persist. On August 27 uptrend, the coin dropped to $56 low but the price corrected upward. The retraced candlestick tested the 50% Fibonacci retracement level. This implies that the coin will fall to 2.0 Fibonacci extension level or $40 low.
Litecoin Indicator Analysis
Meanwhile, LTC is at level 40 of the daily Relative Strength Index. It indicates that Litecoin is in a bearish trend zone and tends to fall. The coin is also below the centerline 50. The price bars are below the EMAs which suggest a further downward movement of the coin.

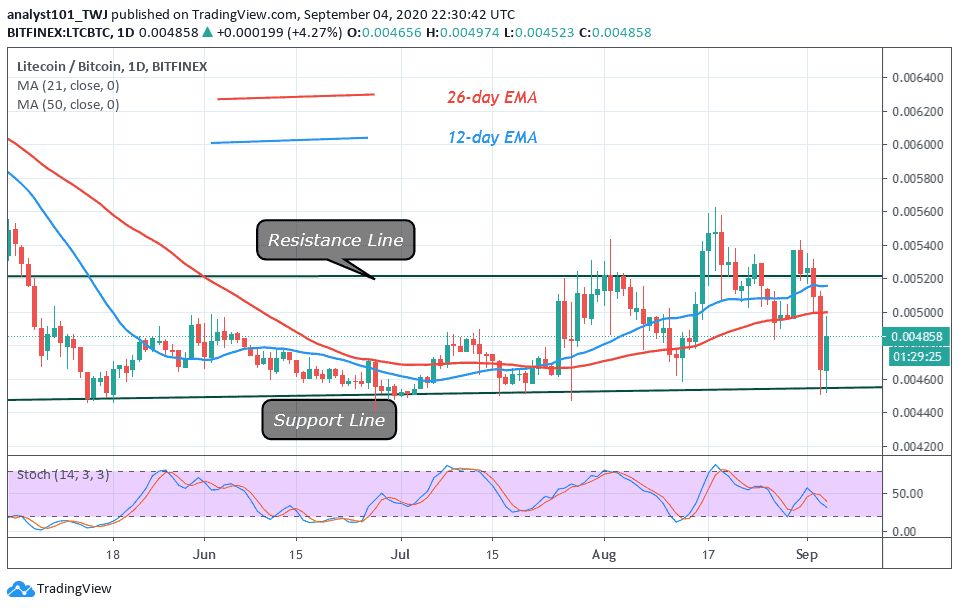
On the LTC/BTC chart, the coin is in a range bound movement between Ƀ0.004600 and Ƀ0.005400. The bulls have earlier broken the resistance level to push BTC above the resistance but were repelled. The bears have also pushed the coin to the lower price range to sink the coin which has been thwarted. The crypto will continue its range bound move for a few more days, The LTC/BTC is in a bearish momentum as price is below the 50 % range of the daily stochastic.
Join Our Telegram channel to stay up to date on breaking news coverage

