Join Our Telegram channel to stay up to date on breaking news coverage
XRP Price Prediction – September 4
The Ripple (XRP) is recovering from the intraday low amid the improved market sentiments.
XRP/USD Market
Key Levels:
Resistance levels: $0.28, $0.29, $0.30
Support levels: $0.21, $0.20, $0.19
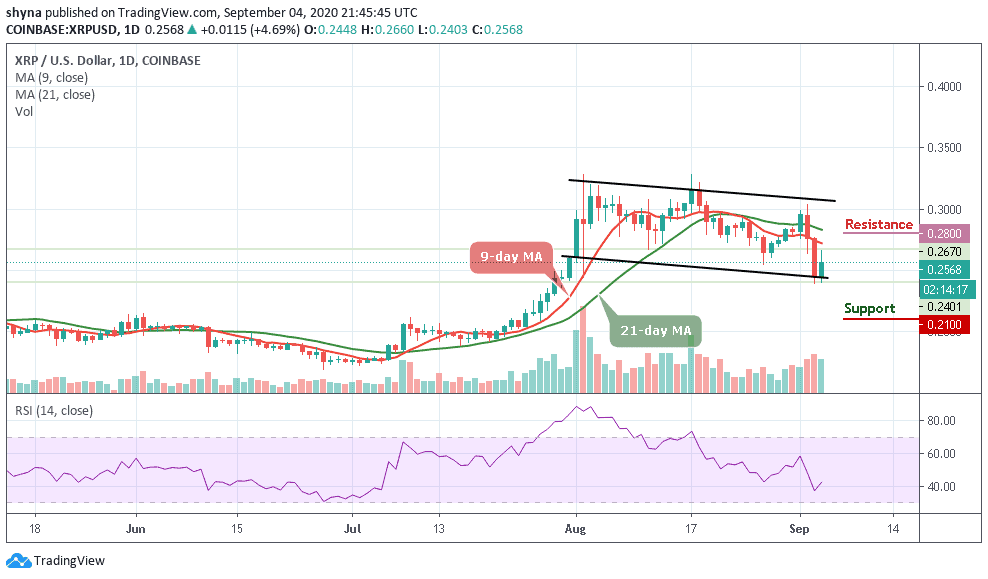
XRP/USD regains ground after a severe sell-off to $0.240 during early Asian hours of today. Currently, XRP/USD is changing hands at $0.256, having gained over 4.6% since the start of the day. Despite the recovery, the coin is still 2% lower from this time of yesterday. Ripple now takes fourth place in the global cryptocurrency market rating, with the current market capitalization of $11.5 billion.
What to Expect from Ripple (XRP)?
XRP/USD has been hit hard by the recent market-wide sell-off, with the cryptocurrency’s price erasing the vast majority of the gains that it has been able to gain over the past few months. Meanwhile, a sustainable move above $$0.30 is needed to improve the technical picture and set the bullish ball rolling for the coin. This resistance area has been tested but each time, the bulls always backed off.
The daily chart shows that the price recovery is capped by 9-day MA at $0.273. This technical line has been tested as support on several occasions late last month; now, it has been verified as a resistance. Once it is out of the way, the upside is likely to gain traction with the next focus on the above-mentioned congestion area of $0.28, followed by the recent XRP’s recovery high on approach to $0.29 and $0.30 resistance levels. The support levels are found at $0.21, $0.21, and $0.23 respectively.
When compares with Bitcoin, the Ripple keeps moving around 2426 SAT within the 9-day and 21-day moving averages. After the coin touches the daily high at 2530 SAT today, the coin later retreated back below the channel. Meanwhile, the bearish scenario remained dominant as the sellers continued to put pressure on the market.
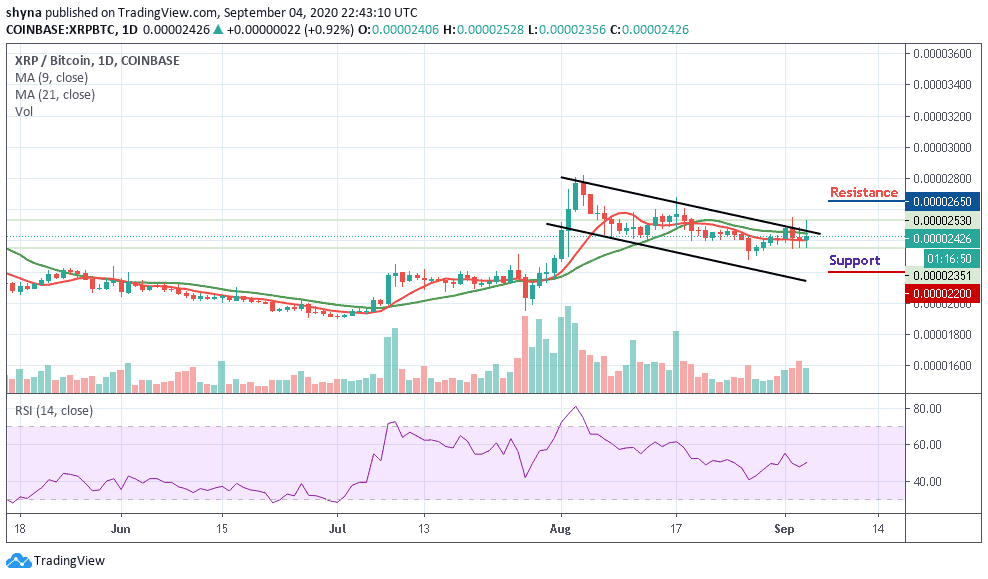
However, if the sellers put more pressure, XRP/BTC may drop to 2200 SAT and below. At present, the RSI (14) moves around 50-level as the market remains at the upper side of the channel where the bulls can easily push the coin towards the resistance levels at $2650 and above.
Join Our Telegram channel to stay up to date on breaking news coverage