Join Our Telegram channel to stay up to date on breaking news coverage
Bitcoin (BTC) Price Prediction – September 4
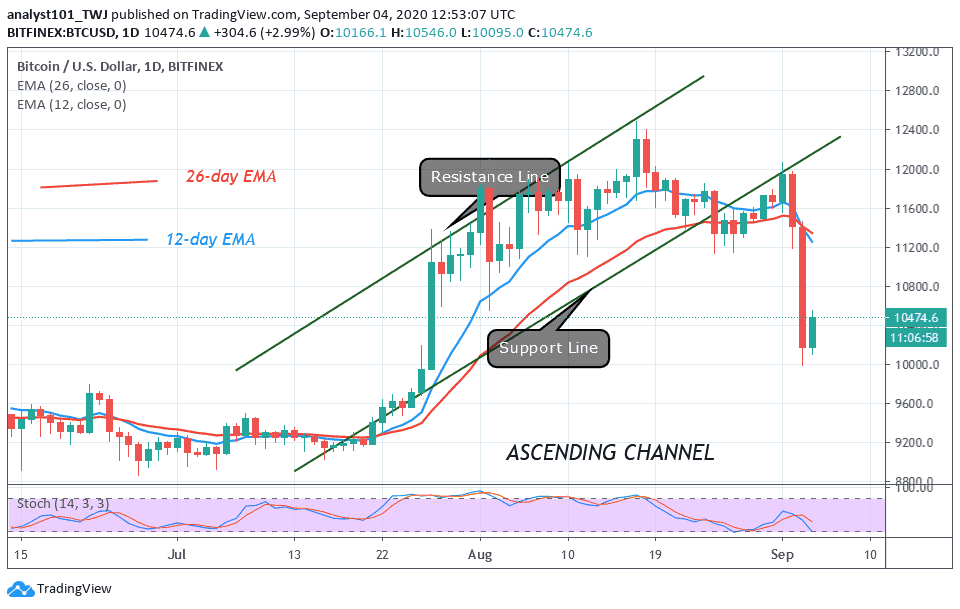
The daily chart reveals that BTC/USD bulls are making a come-back after the two heavily bearish days.
BTC/USD Long-term Trend: Ranging (Daily Chart)
Key levels:
Resistance Levels: $11,200, $11,400, $11,600
Support Levels: $9,200, $9,000, $8,800
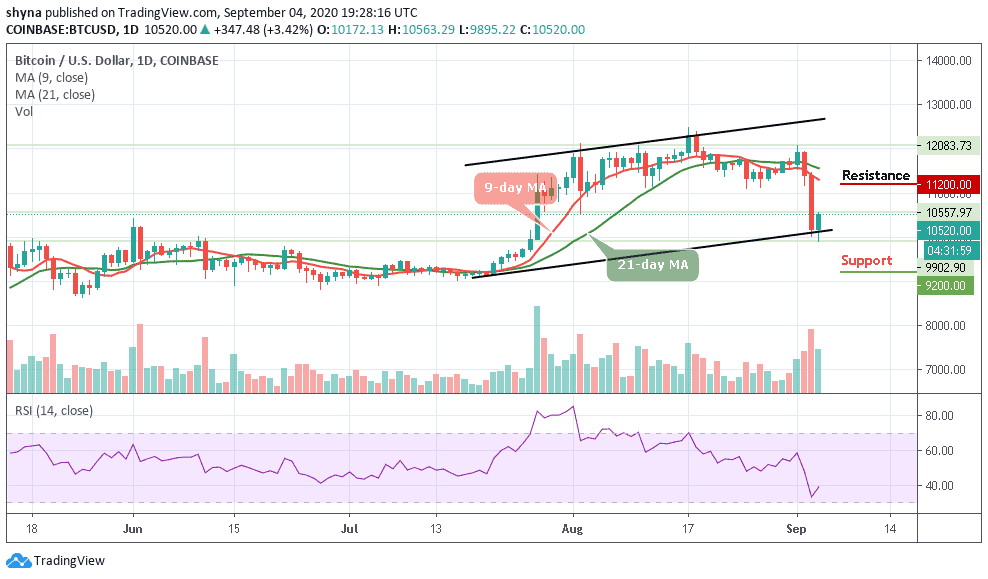
At the time of writing, BTC/USD is teetering at $10,520. There have been instances when BTC has exchanged hands above $10,300 sustaining the bullish price action is an uphill task. Nevertheless, the path of least resistance is still downwards. The daily chart shows that the coin remains below the 9-day and 21-day moving averages.
Would Bitcoin (BTC) Go up or Down?
Looking at the daily chart, if the pennant support caves in, even $10,000 could not manage to hold as support. Therefore, BTC/USD is likely to fall to $9,500 after taking a pit stop at the support highlighted by the lower boundary of the channel. According to the technical indicator RSI (14), Bitcoin (BTC) is not done with the downside. This means that there is still room that could be explored by the bears.
On the upside, recovery may not come easy as the support will have to be sorted above the $11,000 level. The other seller congestion zone to keep in mind includes $11,200, $11,400, and $11,600. In other words, if the market drops more, it may likely see the critical supports at $9,200, $9,000, and $8,800 as the RSI (14) mores below 40-level.
BTC/USD Medium – Term Trend: Bearish (4H Chart)
The 4-hour chart for BTC/USD is trending in a downward channel formation. In the early hours of today, Bitcoin (BTC) is seen moving from $10,107 to $10,595 where the coin is currently changing hands. On the downside, we have one healthy support at $10,200. Further support could be around $9,850 and below.

However, the technical indicator RSI (14) is recovering from the oversold region, now moving above the 35-level. BTC/USD is hovering above the 9-day moving average, further bullish movements could push the price above the 21-day moving average before reaching the potential resistance at $11,300 and above.
Join Our Telegram channel to stay up to date on breaking news coverage