Join Our Telegram channel to stay up to date on breaking news coverage
Bitcoin (BTC) Price Prediction – September 4, 2020
After a brief consolidation above $11,200, the downtrend resumes as price breaks the $11,200 and the 11,100 support. This accelerated the downward movement of prices. The bottom line is that BTC/USD has dropped to $10,500.
Resistance Levels: $10,000, $11, 000, $12,000
Support Levels: $7,000, $6,000, $5,000
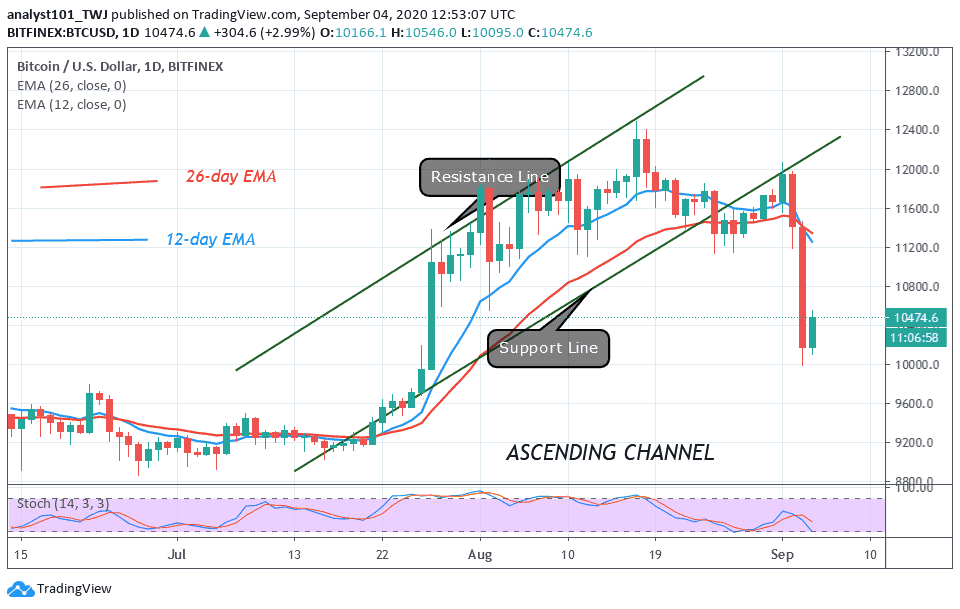
Bitcoin bullish scenario has been invalidated as the $11,200 support was broken. The bulls failed to defend the next crucial support at $11,200. The upside momentum could have resumed if the $11,200 was held. The bearish scenario will follow each time Bitcoin loses a crucial support level. As the bears broke the $11,200 support, the selling pressure resumed.
Bitcoin dropped to $11,000 and subsequently, the downward onslaught reached the $10,500 low. The downtrend is not over as the selling pressure will resume if the $10,400 support is breached. Analysts believe that losing the $10,400 will invalidate the bullish scenario and that will open the door for further decline. Meanwhile, price is still fluctuating above $10,500 at the time of writing. BTC is now at a 20% range of the daily stochastic. This suggests that Bitcoin is approaching the oversold region of the market.
BTC Price May Deepen Below $10,000 as Traders’ Eye ‘CME Gap’
For the first time since July, the Bitcoin price has fallen below $10,000. This is a result of an aggressive week of selling that has compelled BTC price to fall. BTC price is fluctuating between $10,000 and $10,500 support levels. Nevertheless, if the support levels are breached, there is the likelihood of a further correction towards $9,600 to $9,900. Traders believe that the recent correction below $10,500 suggests the likelihood of a CME gap-fill between $9,600 and $9,900. It has been observed that the $9,600 to $9,900 is a massive pivot where we have an open CME gap.
This ‘CME gap’ occurs when the markets make an aggressive move outside the trading hours of Chicago Mercantile Exchange’s Bitcoin futures markets. This often results in a price gap on the charts. Many traders are wondering whether the CME gap is behind the latest crypto crash. Some believe in a high correlation between Bitcoin and the legacy markets. The general opinion is that many traders are envisaging that prices will drop to reach the mark of the most recent ‘CME gap’ at $9,700.
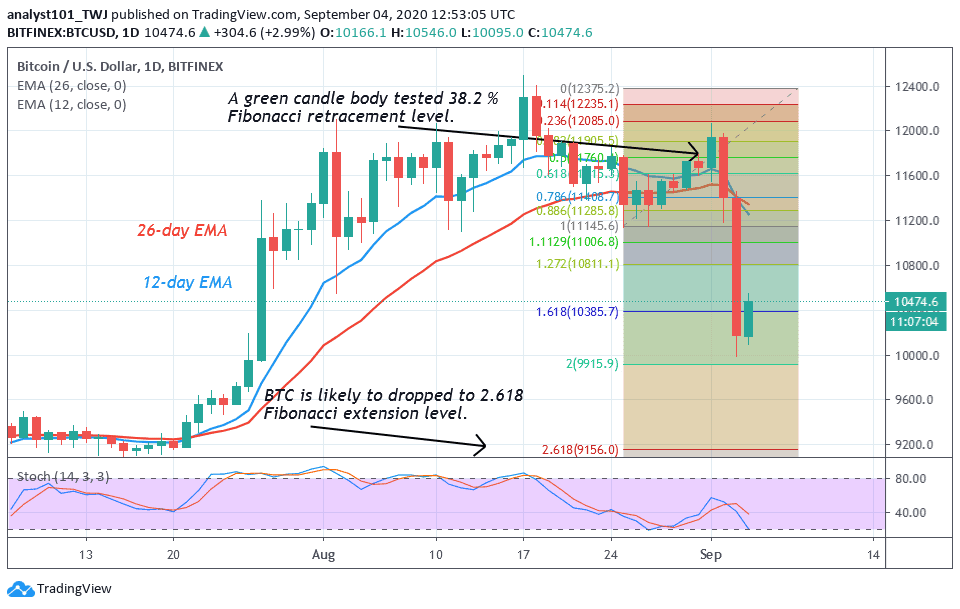
Today, BTC is fluctuating above $10,400 at the time of writing. Nonetheless, there is a likelihood of further downward move. On the August 25 downtrend, BTC fell to $11,200 and corrected upward. The retraced candle body tested the 38.2% Fibonacci retracement level. This implies that Bitcoin will fall to 2.618 Fibonacci extension level or $9,200 low.
Join Our Telegram channel to stay up to date on breaking news coverage