Join Our Telegram channel to stay up to date on breaking news coverage
ETH Price Prediction – September 3
ETH/USD is currently following the downward trend as the price touches the daily low of $390.75.
ETH/USD Market
Key Levels:
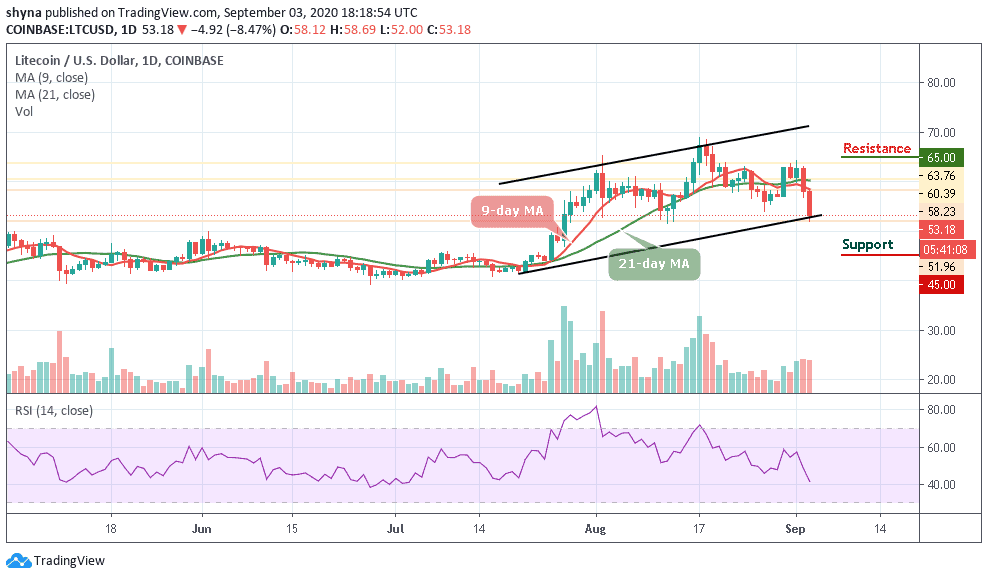
Resistance levels: $490, $510, $530
Support levels: $330, $310, $290
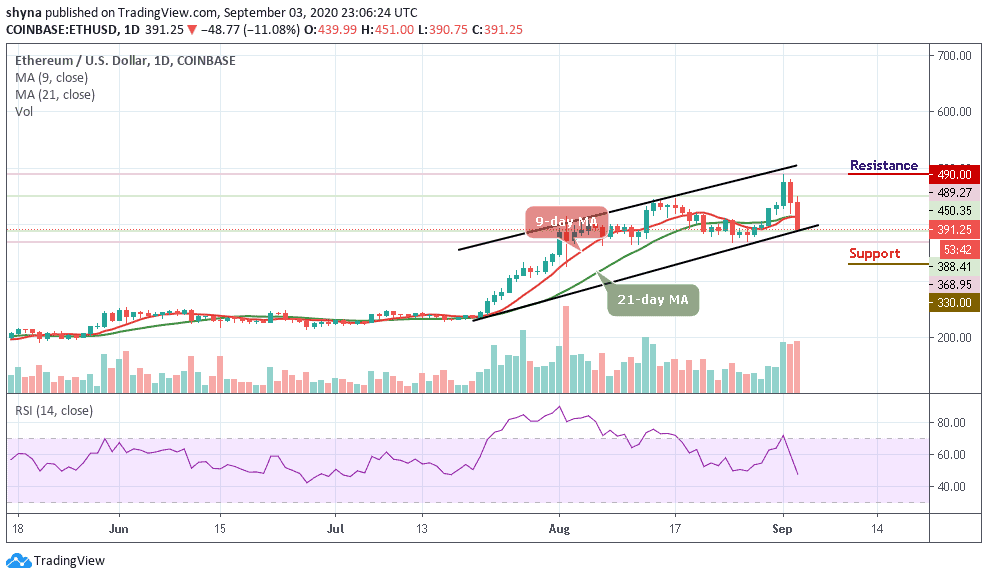
Presently, ETH/USD is hovering at $391.25 following an 11.08% loss on the day. However, the whole market is mainly in the red, with most cryptos having succumbed to downward pressure. Bitcoin (BTC), for example, is crashing more than $1,500 in 48 hours. However, for ETH/USD, there is a possibility of retracement towards $450 may play out if the price moves above the 9-day and 21-day moving averages.
Where is Ethereum (ETH) Going Next?
If the sellers push ETH beneath the lower boundary of the channel, the next support lies at $360. This is followed by significant support below the $350 level, and a downside may come into focus. If $350 breaks, further support lies at $330, $310, and $290 levels.
However, the technical indicator RSI (14) is moving beneath the 50-level, and if it continues to fall, the increased bearish pressure could drive ETH/USD toward the lower boundary of the channel. However, the signal line may drop more and looks primed for another bearish crossover signal. On the contrary, if the bulls make an attempt to cross above the moving averages, LTC/USD may likely enjoy a free-ride the resistance levels of $490, $510, and $530 respectively.
When compares with Bitcoin, Ethereum is seen trading above the 9-day and 21-day moving averages. As the price falls, sellers are posing an additional threat for buyers to reach the support level of 0.035 BTC where the nearest target is located. However, an eventual break below the lower boundary of the channel may cause Ethereum to collapse.
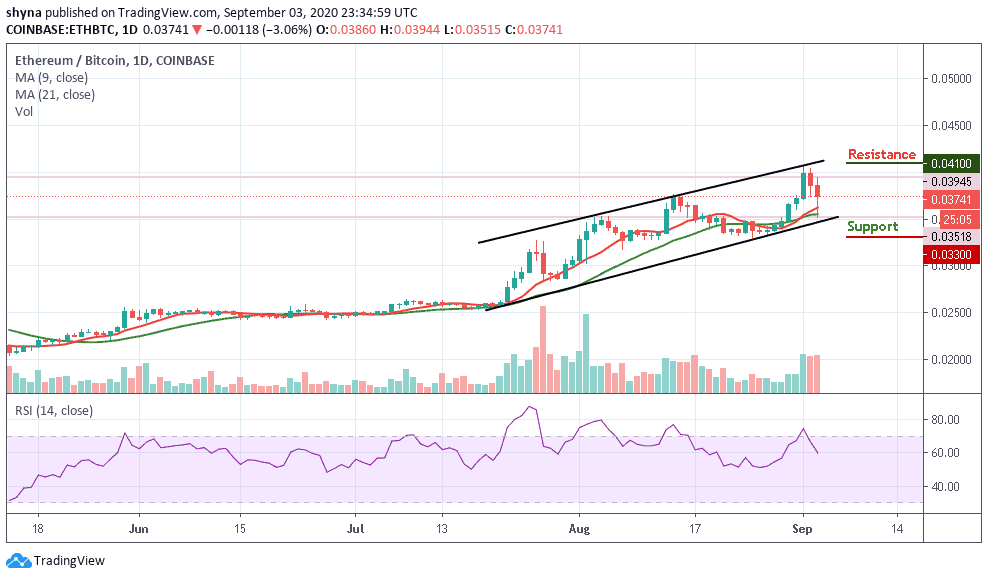
Moreover, the continuation of the downtrend could hit the main support at 0.034 BTC before falling to 0.033 BTC and below. More so, the buyers may likely push the market above the upper boundary of the channel to reach the potential resistance at 0.041 BTC and above if a rebound plays out. The RSI (14) is still focusing on the downside, indicating that the sellers are in control.
Join Our Telegram channel to stay up to date on breaking news coverage