Join Our Telegram channel to stay up to date on breaking news coverage
Litecoin (LTC) Price Prediction – August September 27, 2020
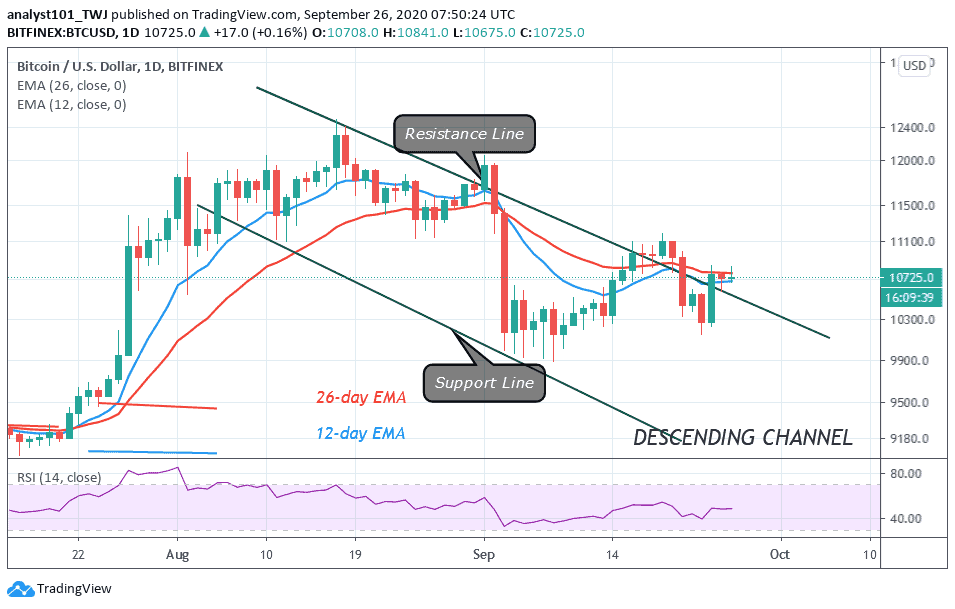
LTC/USD is likely to further decline as the $45 support cracks. Simultaneously, the bulls rebounded at the recent low to push prices upward. The price tussle has continued at the bottom of the chart
LTC/USD Market
Key Levels:
Resistance Levels: $80, $100, $120
Support Levels: $50, $40, $20

Following the breakdown on September 3, the market was fluctuating between $45 and $51 for over two weeks. On September 21, the bears broke the $45 support as price dropped to $41 low. Today, the market is fluctuating between $41 and $45 in a tight range. On the downside, if price breaks below the current support, the market will fall and revisit the previous low at $39. However, as price rebounded above the $41, it retested the $45 high. The downtrend is likely to be delayed. Nonetheless, if the $41 support is eventually broken, the Fibonacci analysis tool will hold. That is, LTC will fall to the 1.272 Fibonacci extension level or $39.11 low.
Litecoin Indicator Analysis
After an earlier bullish move, LTC faces rejection at the 12-day EMA. Litecoin will not rise except it breaks above the EMAs. The EMAs are pointing southward indicating the downtrend.LTC is above 25% of the daily stochastic. The bullish momentum is waning away.
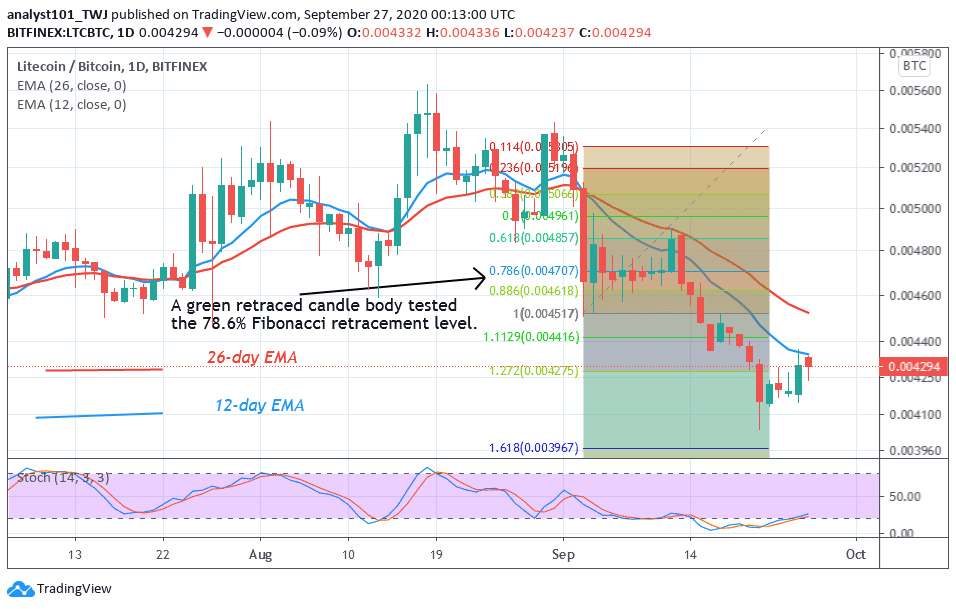
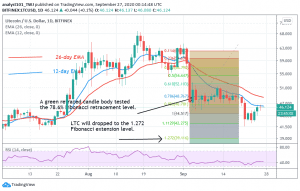
On the LTC/BTC chart, the coin is on a downward move. The bears broke the current support at Ƀ0.004600 to resume the downtrend. On September 3 downtrend; the green retraced candle body tested the 78.6% Fibonacci retracement level. It indicates that the market will fall and reach a low of 1.272 Fibonacci extensions or Ƀ0.004600
Join Our Telegram channel to stay up to date on breaking news coverage