

Join Our Telegram channel to stay up to date on breaking news coverage
Litecoin (LTC) Price Prediction – August 22
LTC/BTC reached a peak price of $68 but the bulls fail to sustain the uptrend. Consequently, the market dropped sharply. In the LTC/BTC, the market is in a sideways trend as price fluctuates between levels Ƀ0.004500 and Ƀ0.005200.
LTC/USD Market
Key Levels:
Resistance Levels: $80, $100, $120
Support Levels: $50, $40, $20
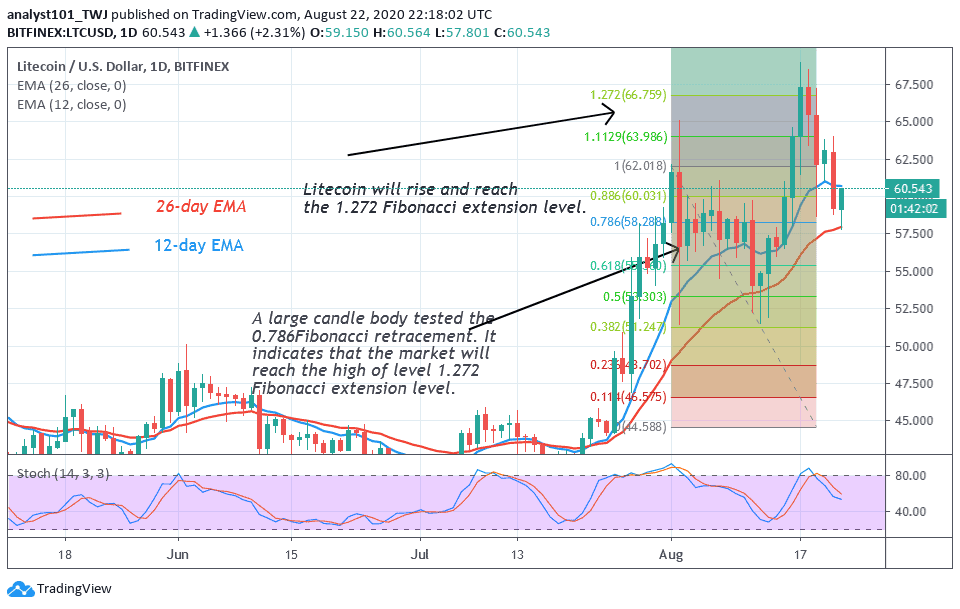
Today, Litecoin is at $60 after it has attained a peak price of $68 high. The $60 price level has been a crucial support when it was a resistance and now a support level. Since on August 1, the $60 resistance was difficult to be broken. On August 1, the bulls broke the resistance but price plunged back below the resistance. On August 16, the bulls broke the resistance as price rallied to $68 high. Unfortunately, the coin reached the overpriced region of the market.
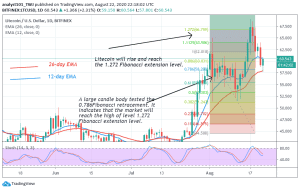
Consequently, the coin fell to the previous low. On the upside, for the coin to resume the uptrend, the $60 support mush hold. The above price action has been confirmed by the Fibonacci tool. The $68 high is the 1.272 Fibonacci extension level. The Fibonacci rule indicates that if price reaches the 1.272 extension, the market will reverse to 78.6% retracement level. That is the $60 price level.
Litecoin Indicator Analysis
LTC price is still above 26-day EMA which indicates that price will rise. The coin is below 80% range of the daily stochastic. It indicates that the market is in a bearish momentum. Presently, the price action is showing bullish signals which are contrary to the bearish momentum.
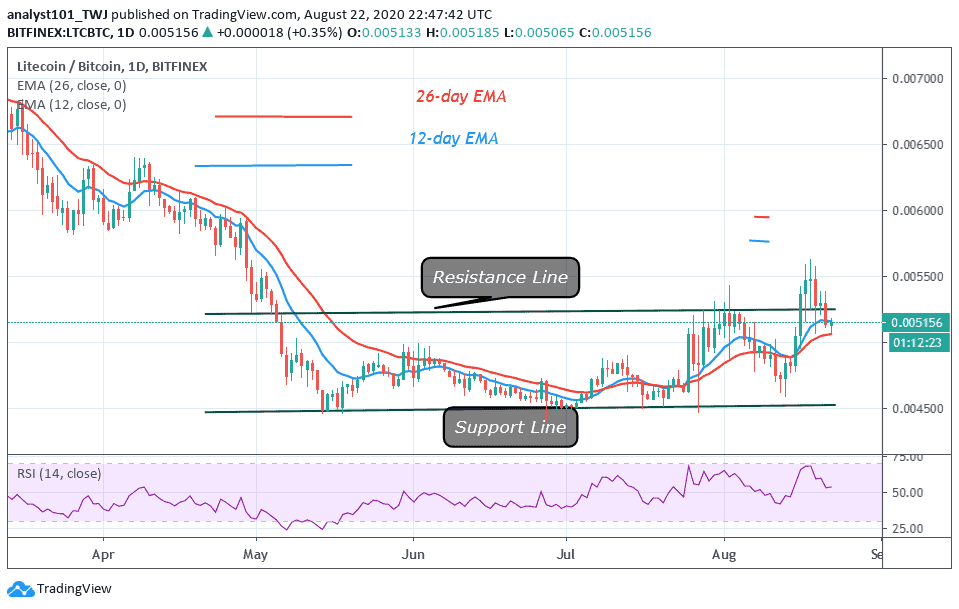
On the LTC/BTC chart, is in a sideways move. The price has been fluctuating between level Ƀ0.004500 and Ƀ0.005200. The coin is yet to trend. Since May the key levels of the market have not been broken. In July and August, the bulls attempted to break the resistance line but were unable to push above the resistance. The coin is at level 54 of the Relative Strength Index period 14. It indicates that the coin is in the uptrend zone.
Join Our Telegram channel to stay up to date on breaking news coverage
