Join Our Telegram channel to stay up to date on breaking news coverage
Bitcoin Cash (BCH) Price Prediction – August 22, 2020
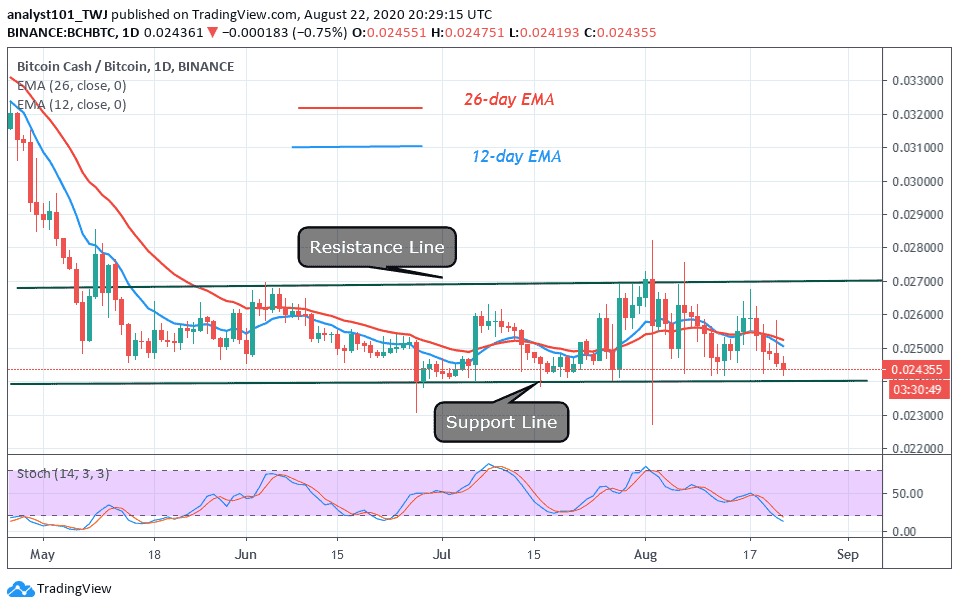
BCH/USD is in a sideways move below the $320 resistance. The bulls are to jump the two hurdles at $320 and $340 as price continues the range-bound movement. In the BCH/BTC, the coin is also in a sideways move, as price fluctuates between levels Ƀ0.024000 and Ƀ0.027000.
BCH/USD Market
Key Levels:
Resistance Levels: $280, $320, $340
Support Levels: $200, $160, $120

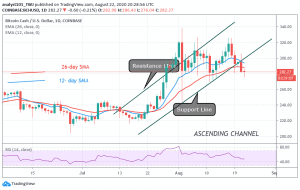
Since August 1, Bitcoin Cash as been fluctuating between levels $280 and $320. Buyers were unable to break the $320 resistance. Likewise, bears were also unable to break the support at $280. The crypto has been range-bound in the last three weeks. If price rebounds above $280 support, the momentum will propel price to retest the $320 resistance. The market will resume uptrend once the $320 price level is breached. Alternatively, Sideways move will continue between $280 and $320 if the $320 resistances remain unbroken. Meanwhile, price is above the $280 support. Nevertheless, the price action is showing bearish signals at the time of writing
Bitcoin Cash Indicator Analysis
There are indications that the downward move may resume. The price has broken below the 12-day EMA and the 26-day EMA. This indicates that BCH will further depreciate. The coin is at level 47 of the Relative Strength period 14. The market is in the downtrend zone and may likely fall.

In the BCH/BTC chart, the market is in a sideways trend. The coin is fluctuating between levels Ƀ0.024000 Ƀ0.027000. Since on May, the price has not broken the key levels of the sideways trend. In the meantime, the coin is below 20% range of the daily stochastic. The market is approaching the oversold region.
Join Our Telegram channel to stay up to date on breaking news coverage

