Join Our Telegram channel to stay up to date on breaking news coverage
Bitcoin (BTC) Price Prediction – August 22
Bitcoin (BTC) has confirmed the lack of strength by the bulls as buyers could not fix above the $12,000 mark.
BTC/USD Long-term Trend: Bullish (Daily Chart)
Key levels:
Resistance Levels: $12,300, $12,500, $12,700
Support Levels: $10,800, $10,600, $10,400
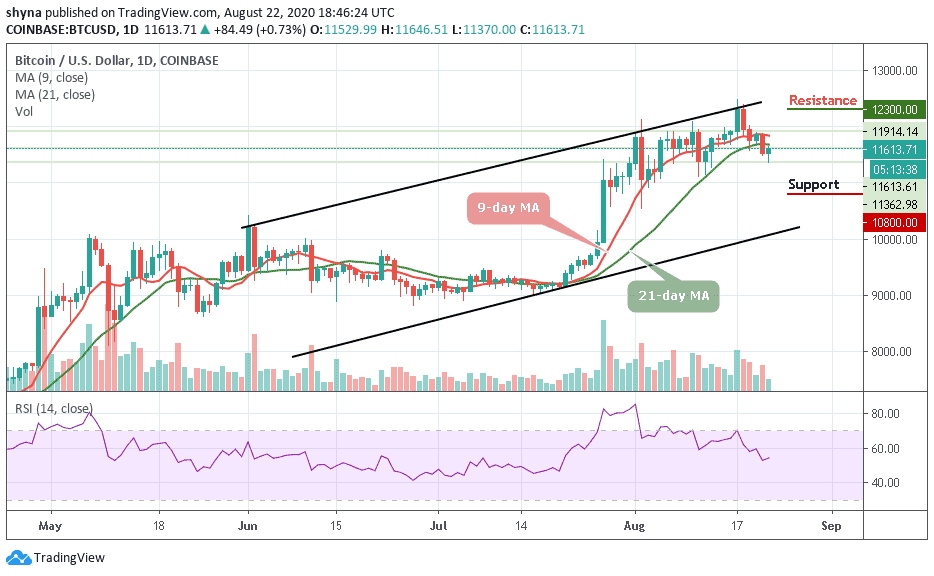
BTC/USD is making a surprising move after touching the daily low of $11,362. The first digital asset is now struggling to climb higher as its price struggles to break above the upper $11,000 region. The rate for the leading crypto has dropped by 2.17% in the last 7 days. Looking at the daily chart, BTC/USD bounced off its $11,400 support zone. The decline did not continue further due to the low selling volume.
What to Expect from Bitcoin (BTC)
The coin is moving below the 9-day and 21-day moving averages, the $11,300 and $11,200 levels are initial supports. If the bulls fail to defend another support at $11,100, there is a risk of a sharp decline. The next key supports on the downside could be $11,000, where the bulls are likely to take a strong stand. But if the bulls fail to take a stand, then, BTC/USD may drop further to the critical supports of $10,800, $10,600, and $10,400 respectively.
Nevertheless, if there is a clear break above the 9-day and 21-day moving averages, the Bitcoin price could retest the $11,900 resistance level. If the bulls manage to gain strength above this level, there are chances of a decent recovery towards the $12,100 resistance area. The key breakout zone is near the $12,300, $12,500, and $12,700 resistance levels as the RSI (14) moves above 52-level.
BTC/USD Medium-Term Trend: Bearish (4H Chart)
Looking at the 4-hour chart, the situation is almost identical. The bears have seized on the initiative, and within the upcoming days, are likely to be bearish. Furthermore, a bearish divergence is forming on the RSI (14), which could consider the price to drop.
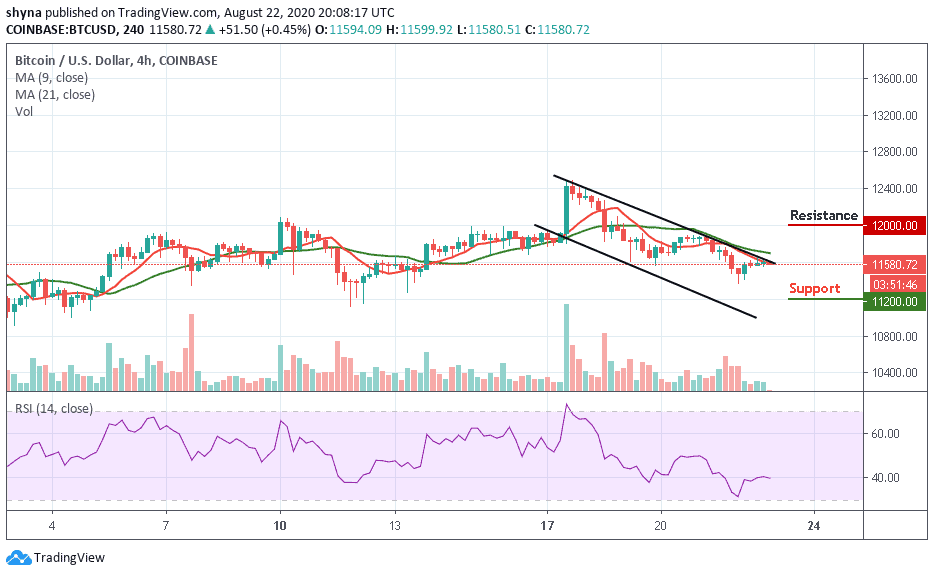
Moreover, the trading volume remains at the same level, which is also a signal of a decline. If the bulls do not hold the $11,500 mark, then the next support could be $11,200 and below while the resistance level lies above the 9-day and 21-day moving averages at $12,000 and above.
Join Our Telegram channel to stay up to date on breaking news coverage