Join Our Telegram channel to stay up to date on breaking news coverage
Litecoin (LTC) Price Prediction – August 21
LTC/USD is on a downward move after retesting the resistance at $64. LTC price will fall into the previous price range if the $60 support is breached. Similarly, LTC/BTC is also falling after retesting level Ƀ0.005600.
LTC/USD Market
Key Levels:
Resistance Levels: $80, $100, $120
Support Levels: $50, $40, $20

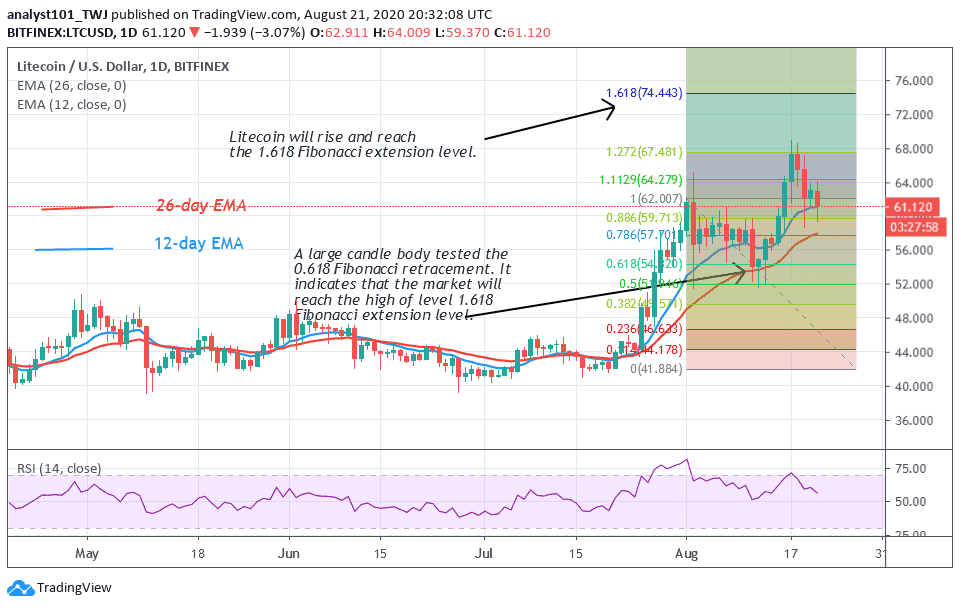
After attaining the peak price at level $68, sellers were overpowering as LTC dropped to $58 low. The bulls buy the dips as the market shoots up above the $60 high. The bears are unrelenting as price was repelled after retesting the $64 high. LTC will rise if the $60 support holds. On the other hand, if the bears break the current support, LTC will fall to either $54 or $56 low.
In the August 1 uptrend, LTC was repelled at the $64 high. The retraced candle body tested the 61.8% Fibonacci retracement level. This indicates that the market will rise and reach the 1.618 Fibonacci extension level. In other words, the market will reach a high of $76.
Litecoin Indicator Analysis
The coin is at level 55 of the Relative Strength Index period 14. It indicates that the crypto is in the uptrend zone and will rise. The market will rise as long as price is above the EMAs. Otherwise, a downward move will ensue.

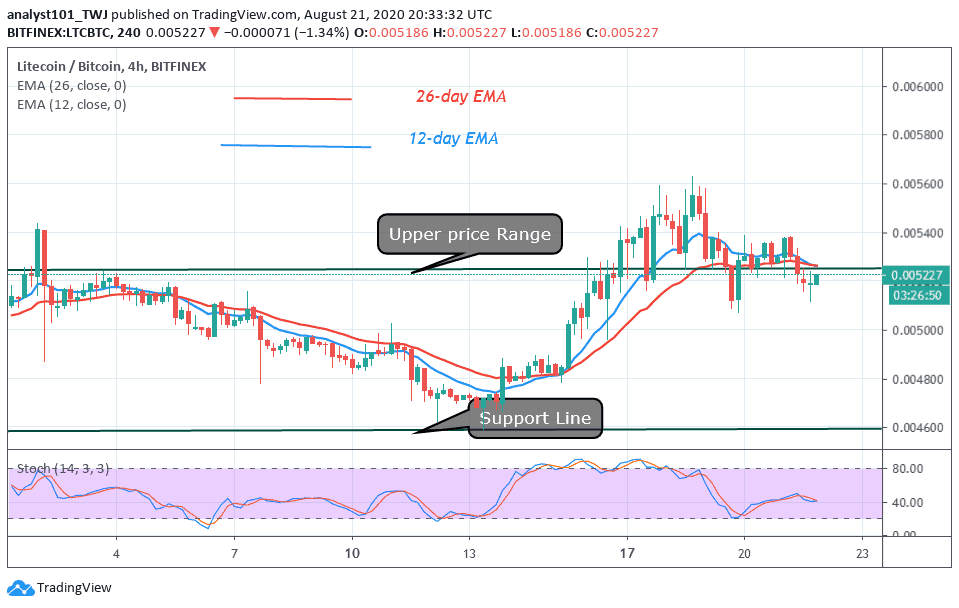
On the LTC/BTC chart, the coin was earlier in an upward move as price reached a high of Ƀ0.005600. The coin faced rejection as price fell into the previous range-bound zone. As price fell into the previous range, the market will be fluctuating between levels Ƀ0.004600 and Ƀ0.005200. The crypto is above 40% range of the daily stochastic. It indicates a bearish momentum which is contrary to the price action. The price is presently in the range bound zone .
Join Our Telegram channel to stay up to date on breaking news coverage

