

Join Our Telegram channel to stay up to date on breaking news coverage
Bitcoin (BTC) Price Prediction – August 21, 2020
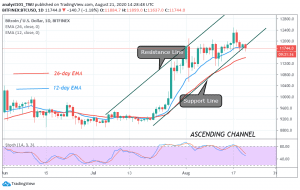
BTC/USD dropped to $11,654 low and corrected above $11,800. Today, the price is falling again to the previous low at $11,600. BTC will face serious selling pressure if it falls beyond the crucial support levels.
Resistance Levels: $10,000, $11, 000, $12,000
Support Levels: $7,000, $6,000, $5,000
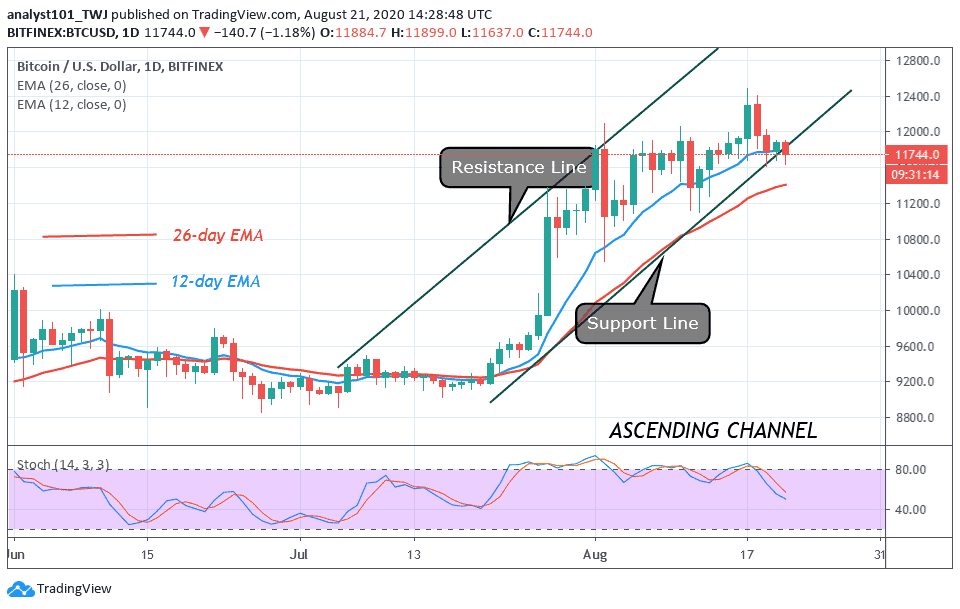
The crucial support levels of $11,400 and $11,600 were being tested soon after the last breakdown. The support at $11,600 is holding as price is being repelled. After a recent breakdown, price is fluctuating between $11,600 and $12,000. From the August 1 uptrend, BTC was first resisted as the retraced candle body tested the 78.6% Fibonacci retracement level. This indicates that Bitcoin will rise and reached the 1.272 Fibonacci extension level. BTC has fulfilled the recent high of $12,400 (level 1.272). The unfulfilled aspect is that the king coin will return to a 78.6% retracement level or the low of $11,300. Therefore, Bitcoin is likely to reach a low of $11300.
Bitcoin Outperforms 5 National Currencies in 2020
Bitcoin is a digital currency that is in a strong performance against all global currencies. Analysts believe that the trend could continue. This is in favor of the argument that BTC is developing as a store of value. Presently, the Bitcoin price has surged by 50% to 128% against all national currencies. It is performing better against devaluing currencies with rates of inflation. For instance, Argentina (peso) recorded 53% in 2019, the highest in 30 years. Concerning Brazil (real) and Argentina (peso), Bitcoin posted 128.4% and 103.50% gains. The king coin recorded a 56% to 69% gains against reserve currencies like the U.S dollar and the euro.
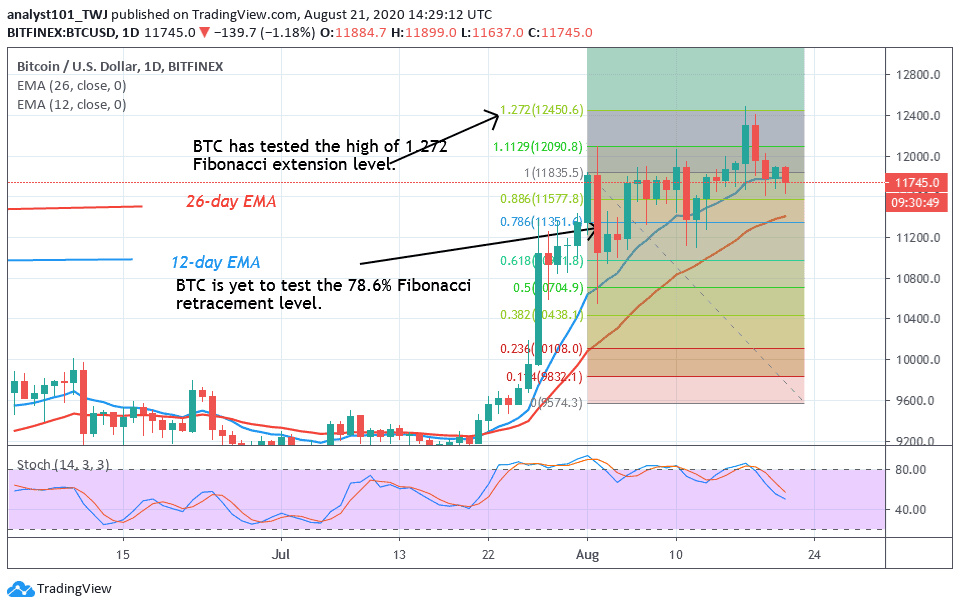
Meanwhile, Bitcoin has continued to fluctuate above $11,600. According to the Fibonacci tool, the market will fall to $11,300. The price fall will be below the crucial support levels of $11,400 to $11,600 where Bitcoin resumes the upside momentum.
Join Our Telegram channel to stay up to date on breaking news coverage