Join Our Telegram channel to stay up to date on breaking news coverage
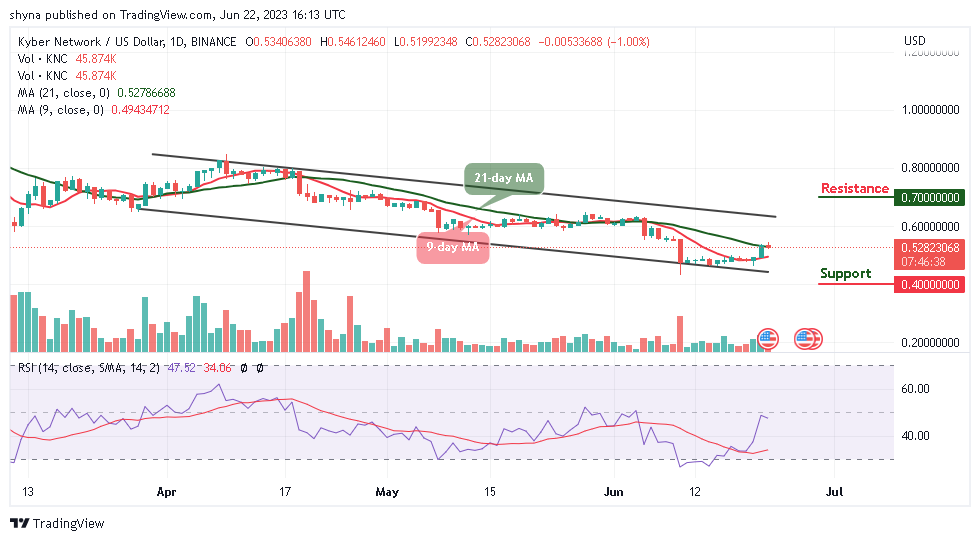
The Kyber Network price prediction shows that KNC is trying to recover from the intraday low of $0.519 amidst the improved market sentiments.
Kyber Network Crystal Prediction Statistics Data:
- Kyber Network Crystal price now – $0.528
- Kyber Network Crystal market cap – $95 million
- Kyber Network Crystal circulating supply – 181.6 million
- Kyber Network Crystal total supply – 227.7 million
- Kyber Network Crystal Coinmarketcap ranking – #197
KNC/USD Market
Key Levels:
Resistance levels: $0.700, $0.720, $0.740
Support levels: $0.400, $0.380, $0.360

KNC/USD may regain ground as the coin trades above the 9-day and 21-day moving averages. At the moment, KNC/USD is changing hands at $0.528 as it is down by 1.00% after touching the daily high at $0.546. Despite the slight recovery, the Kyber Network price is likely to move sideways as the technical indicator implies or it could face a downtrend if the 9-day moving average remains below the 21-day moving average.
Kyber Network Price Prediction: KNC Could Move Sideways
The Kyber Network price remains above the 9-day and 21-day moving averages as seen on the daily chart. Meanwhile, a sustainable move above $0.546 is needed to improve the technical picture and to set the bullish ball rolling for the coin.
Moreover, KNC/USD may trend downwards if the price crosses below the important support level of $0.520. This particular level has been tested as support on several occasions but once this is out of the way, the downside is likely to gain traction with the next focus toward the support levels of $0.400, $0.380, and $0.360. Meanwhile, crossing above the upper boundary of the channel could hit the resistance levels of $0.700, $0.720, and $0.740 respectively.
Against Bitcoin, the Kyber Network keeps moving below the 9-day and 21-day moving averages. After the coin touches the daily high at 1810 SAT today, it could touch another support at 1600 SAT. Nevertheless, the Kyber Network may head to the downside if the sellers increase the selling pressure on the market, and it could drop to 1400 SAT and below.

At the moment, the technical indicator Relative Strength Index (14) remains within the oversold region, which may keep the coin on the downside. On the other hand, if the coin crosses above the 9-day moving averages and heads to the north; the resistance level could be located at $2200 and above.
Kyber Network Alternatives
The Kyber Network price is struggling to cross above the 21-day moving average as the technical indicator Relative Strength Index (14) remains below the 60-level. If the bulls step back into the market, it’s likely for the coin to experience some bullish signals, which can finally encourage more buyers to enter the market.
Nevertheless, Wall Street Memes token has already started generating a lot of buzz in the crypto market. The meme coin symbolizes the Internet’s victory in the infamous Gamestop scandal. This puts the token well on its way to hitting its $10 million target before the expiration of the presale.
Read more:
- Bitcoin Price Prediction: BTC/USD Is Stuck Between $10,660 and $11,000 as Price Resumes Consolidation
- Fantom Price Prediction – FTM Token Up 17% in Two Days on This Positive Update
- Litecoin Price Prediction: LTC/USD Recovers Above $46, Further Upside Is Limited
CoinCodex - Our Recommended Crypto Research Platform
- Live Cryptocurrency Prices for Over 20,000 Coins
- Crypto Price Analysis with Popular Technical Indicators
- Crypto Price Predictions with Short and Long-Term Charts
- Historical Crypto Market Data Dating to 2010
- Crypto Portfolio, Profit Calculator, and Other Investment Tools
Join Our Telegram channel to stay up to date on breaking news coverage


