Join Our Telegram channel to stay up to date on breaking news coverage
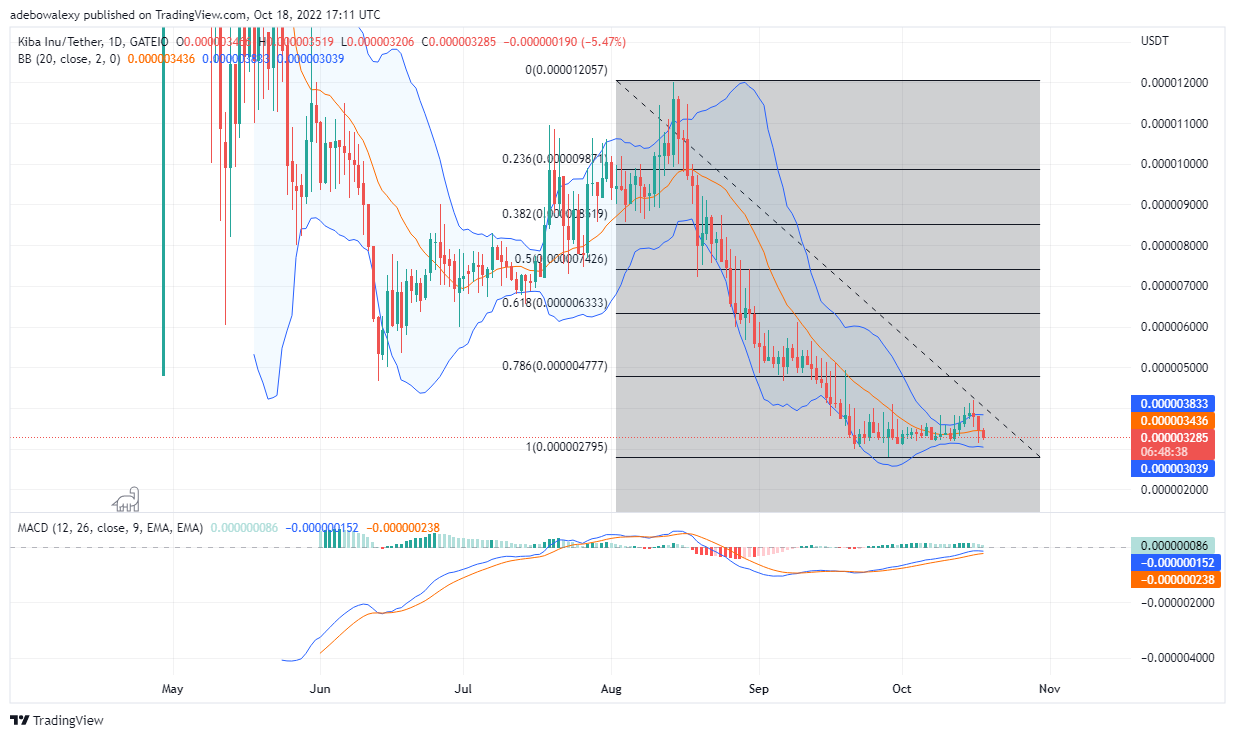
In recent times it looks like Kiba Inu was trying to reverse the trend to the upside. Nevertheless, it turns out that it was only a false alarm. At this point price action has returned to its consolidation phase, going by signs from indicators.
KIBA Forecast Statistics Data:
Kiba Inu current price: is $0.000003285
Kiba Inu market cap: $3.3 million
KIBA circulating supply: —-
Kiba Inu total supply: 1 trillion
KIBA Coinmarketcap ranking: #3786
Key Levels:
Resistance: $0.000003300, $0.000003330, $0.000003370
Support: $0.000003285, $0.000003255, $0.000003215
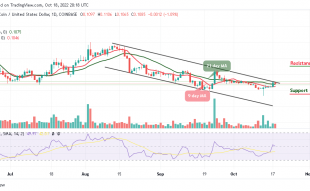
Kiba Inu Price Prediction Today, October 19, 2022: KIBA/USDT Returns to Consolidation
On the 15th of this month price action hit the upper limit of the Bollinger indicator applied in the KIBA/USDT market. Subsequently, this has resulted in a price downside correction. And at this point price has retraced below the MA of the used Bollinger indicator. Interestingly, the last price candle on this chart appears to be testing a strong support around $0.000003280 which has been holding for a while without being broken. Also, the MACD curves are now moving sideways under the point of equilibrium 0.00. The activities on the MACD seem to be predicting that this level may still hold. Eventually, this market will only hold minimal profits for short-term traders.
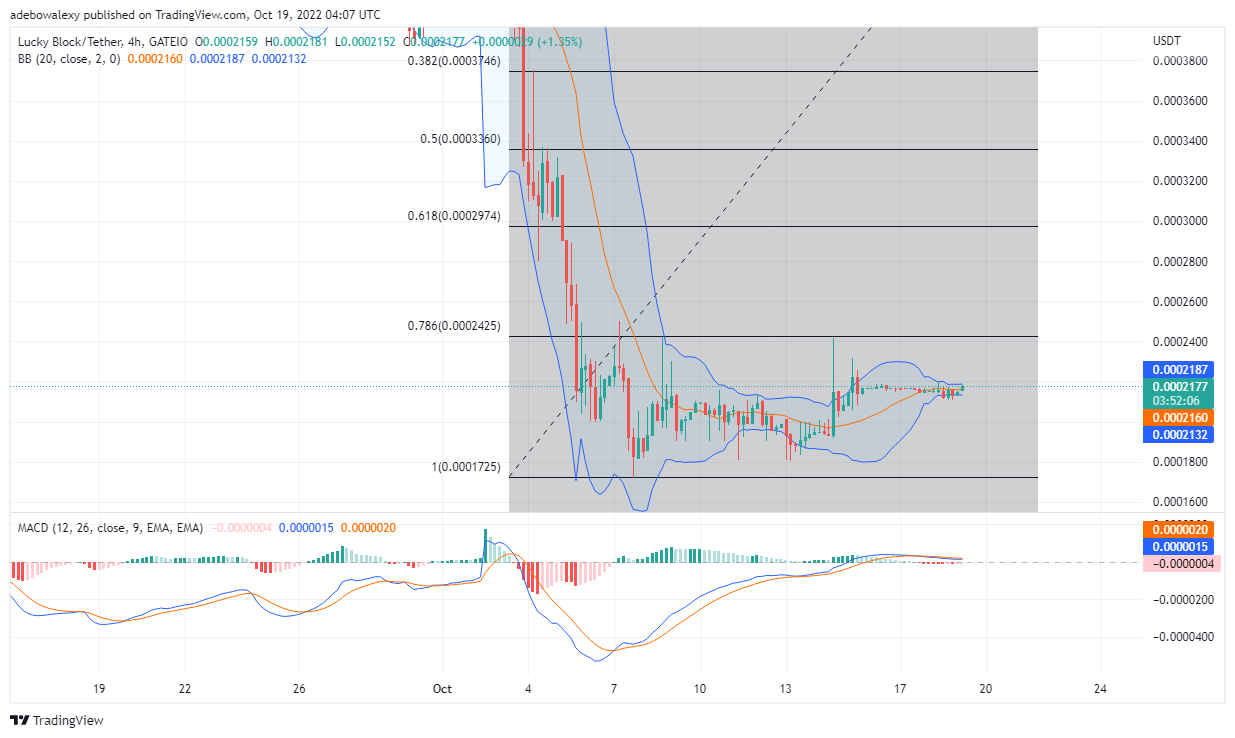
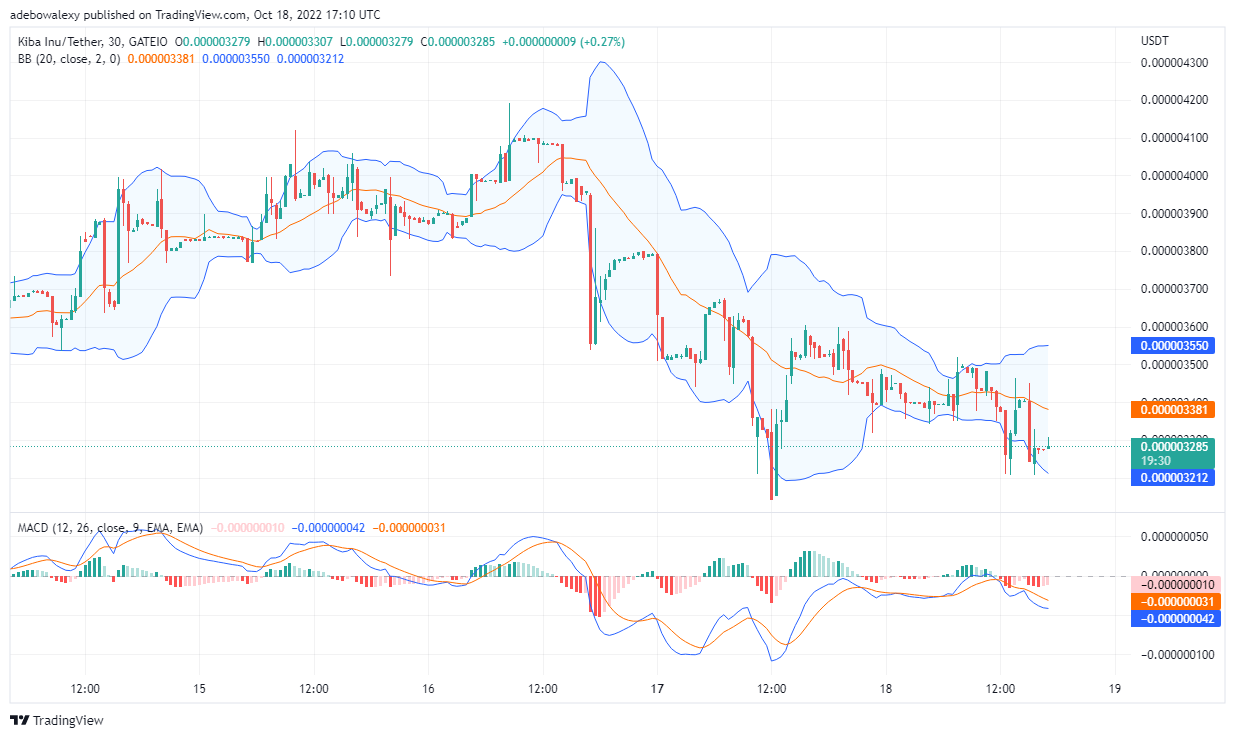
Kiba Inu Price Prediction Today, October 19, 2022: KIBA/USDT Is Bouncing off Support
As earlier stated the KIBA/USDT 4-hour chart reveals that the previously mentioned support may hold. This can be seen as a green price candle appeared just at this price level of $0.000003280. By indications, it appears as if other traders have anticipated this level as a buy level. Consequently, this will cause the price of Kiba Inu to rise from here, however, the magnitude of the upside increase may be unknown.
On the contrary, the MACD indicator appears to be pointing to an increase in downward momentum. Eventually, an increase in downside momentum will cause the support to be eventually broken down. Consequently, this display brings in more doubt about the level holding. Nevertheless, buyers can still buy here to trade on a short-term basis, hoping that this level will hold for an upside correction to occur.
- Related
- How to Buy IMPT
Join Our Telegram channel to stay up to date on breaking news coverage