
Join Our Telegram channel to stay up to date on breaking news coverage
The Helium price prediction reveals that HNT could not climb above the $5.2 level as the coin prepares for a new trend.
Helium Prediction Statistics Data:
- Helium price now – $5.0
- Helium market cap – $644.6 million
- Helium circulating supply – 127.1 million
- Helium total supply – 223 million
- Helium Coinmarketcap ranking – #64
HNT/USD Market
Key Levels:
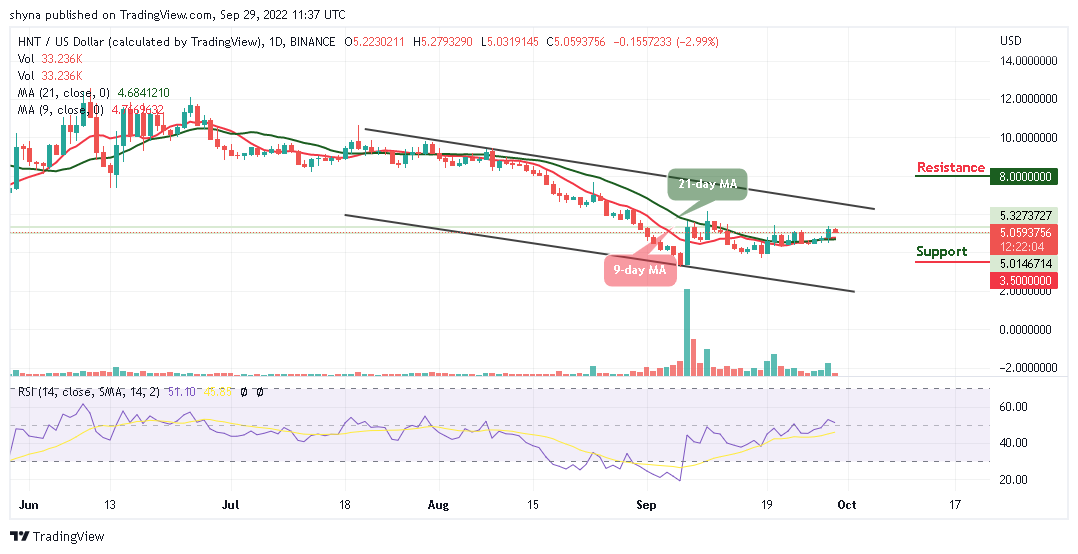
Resistance levels: $8.0, $9.0, $10.0
Support levels: $3.5, $2.5, $1.5
Your capital is at risk
HNT/USD is currently struggling to gather momentum above the $5.2 level. According to the daily chart, the Helium price slides toward the 9-day and 21-day moving averages, but if it breaks below this barrier, the coin may slump towards the lower boundary of the channel.
Helium Price Prediction: HNT May Slump Lower
The Helium price is currently moving sideways. However, if the market price slides to the south, it may experience a period of bearish momentum and it could target the $5.0 support level before critically looking towards the support levels of $3.5, $2.5, and $1.5. Meanwhile, for that not to happen, the bulls would need to push the coin towards the upper boundary of the channel.
More so, if the crypto breaks above the $5.2 resistance level, it may likely face a bullish movement with higher highs and higher lows. Should in case the price decides to maintain the bullish movement above the moving averages, the coin may find the potential resistance levels at $8.0, $9.0, and $10.0. In other words, the technical indicator Relative Strength Index (14) is suggesting a sideways movement for the market as the signal line moves in the same direction above 50-level.
Against Bitcoin, the HNT price is moving sideways, trading above the 9-day and 21-day moving averages within the channel. However, if the bulls attempt to gain momentum, the bears are likely to release slight pressure on the market as the technical indicator Relative Strength Index (14) remains above the 50-level.
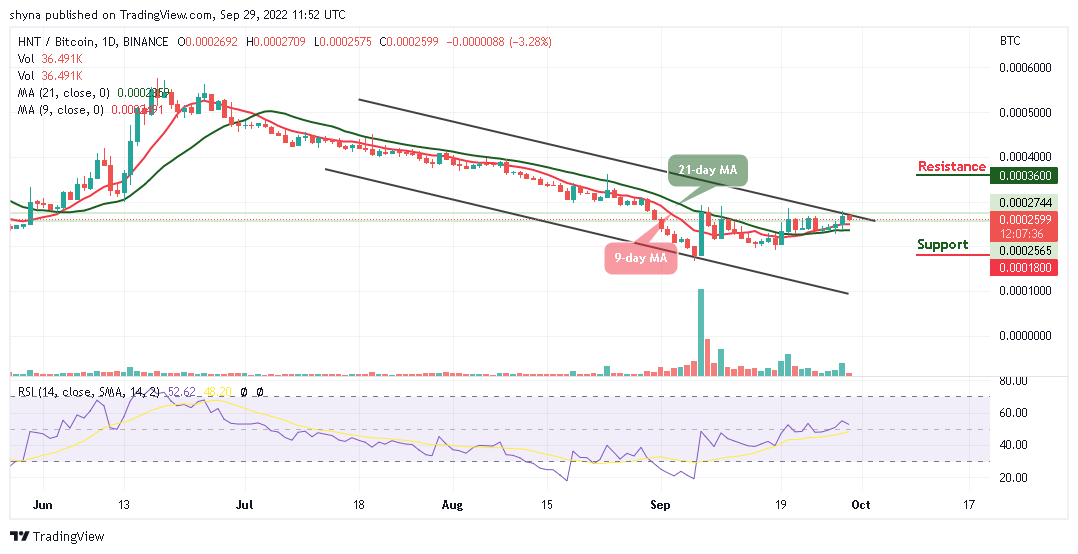
However, if the market price falls and faces the lower boundary of the channel, it may hit the nearest support at 2200 SAT. Any further negative movement could lower the price to the support level of 1800 SAT and below. In case of a rebound, the coin may stay above the moving averages to touch the nearest resistance level of 2700 SAT. If the bulls manage to stay well above this level, traders could see the coin reaching the potential resistance level of 3600 SAT and above.
Read more:
- Ethereum Price Prediction: ETH/USD Loses Critical Support At $167, What’s Next?
- Bitcoin Price Prediction: BTC/USD Falls Again After Rejection From $9,100 Resistance
- Ripple Price Prediction: XRP/USD Rebounds but Stuck Below $0.60 Resistance
Join Our Telegram channel to stay up to date on breaking news coverage