Join Our Telegram channel to stay up to date on breaking news coverage
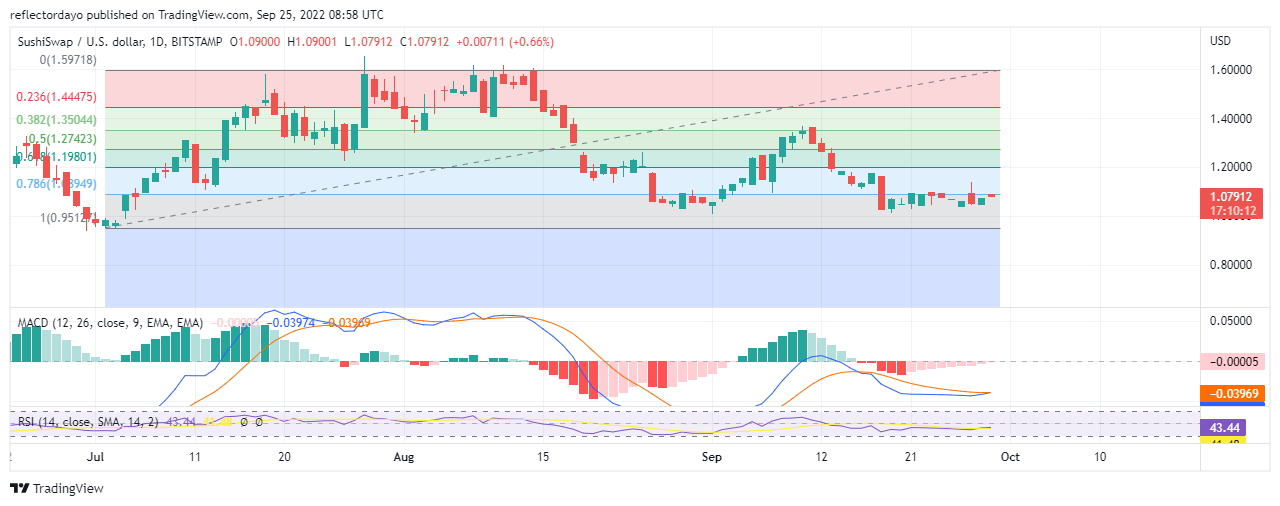
The down-trending market that took its resistance from $1.35134 on the 10th of September did not go too far before it begins to face serious opposition from the bulls. They started to pose serious resistance to the bearish advancement from the third day of the downtrend. Now, as SUSHI/USD takes support at $1.03175, both bulls and bears are becoming evenly matched in the market tug-of-war.
Sushiswap Market Price Statistic:
- SUSHI/USD price now: $1.07912
- SUSHI/USD market cap: $
- SUSHI/USD circulating supply:
- SUSHI/USD total supply:
- SUSHI /USD coin market ranking: #
Key Levels
- Resistance: $ 1.150000, $1.20000 $1.300000
- Support: $1.000000, $0.949800 $0.800000
Your capital is at risk
Sushiswap Market Price Analysis: The Indicators’ Point of View
The price action of the Sushiswap market is converging at around the current price of $1.07912. These indications support the consolidation market sentiment. We can also expect (from the indications that we are getting from MACD) that the market will switch trends to the upside after this consolidating market period. The MACD line is now touching the signal line; preparing for crossing. The weak bearish histogram is progressively reducing in height. In the next session, the histograms may change into bullish ones.
Sushiswap: SUSHI/USD 4-Hour Chart Outlook
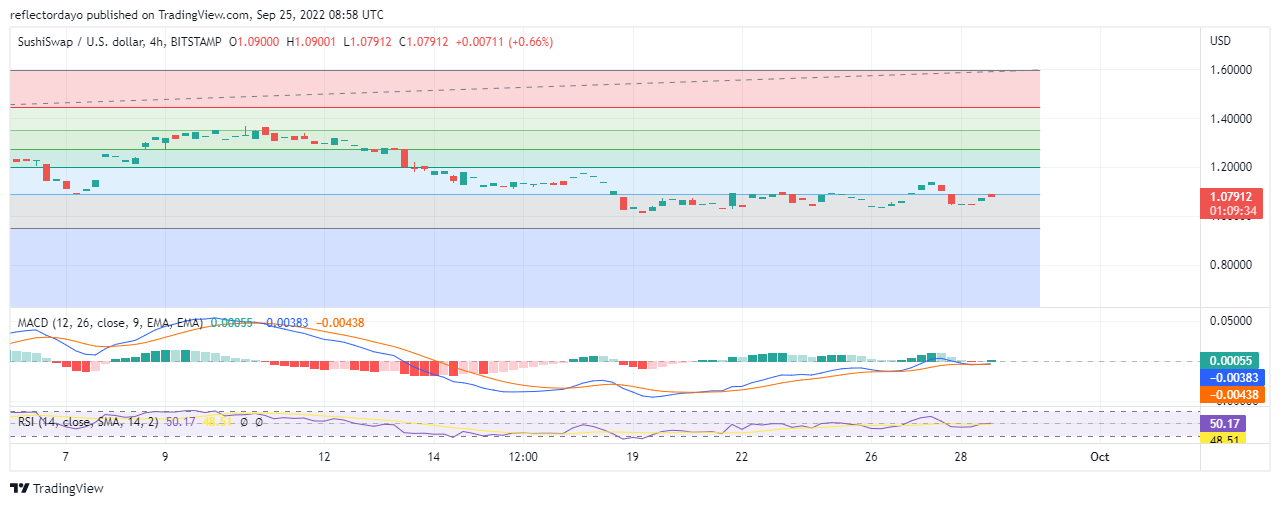
In this shorter time frame, we discover that there are many 4 price doji’s on the chart. This is a highly significant standoff between buyers and sellers. This means that throughout the trading session neither the buyers nor sellers could influence the price in any direction. In this timeframe, indicators are oscillating at the midpoint. Both the MACD and the RSI have their lines oscillating at the midpoint. This confirms the ranging market sentiment
Join Our Telegram channel to stay up to date on breaking news coverage
