Join Our Telegram channel to stay up to date on breaking news coverage
The Hedera Hashgraph price prediction shows that HBAR is likely to cross above the upper boundary of the channel as the coin shoots to the upside.
Hedera Hashgraph Prediction Statistics Data:
- Hedera Hashgraph price now – $0.049
- Hedera Hashgraph market cap – $2 billion
- Hedera Hashgraph circulating supply – 31 billion
- Hedera Hashgraph total supply – 50 billion
- Hedera Hashgraph Coinmarketcap ranking – #33
HBAR/USD Market
Key Levels:
Resistance levels: $0.055, $0.060, $0.065
Support levels: $0.040, $0.035, $0.030
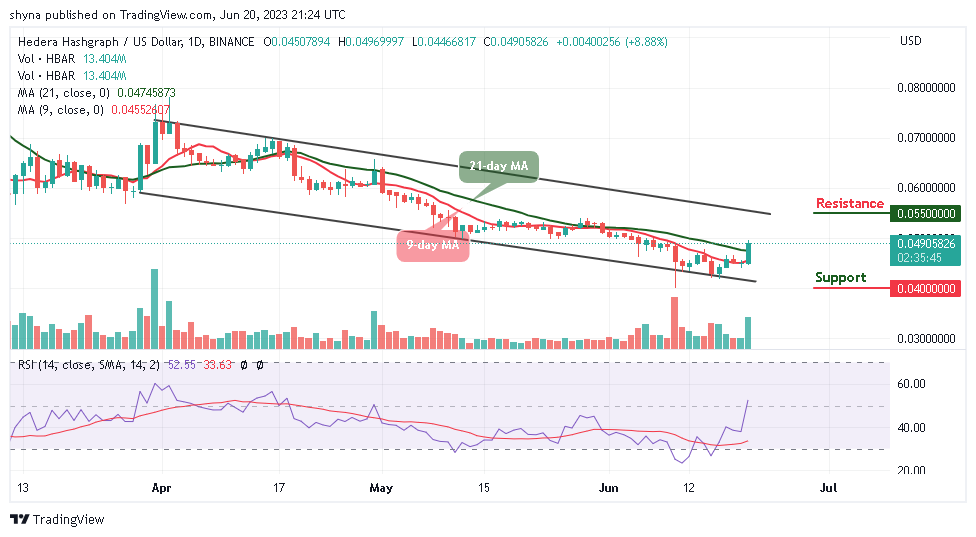
HBAR/USD is currently trading at $0.049 after touching the daily low of $0.044, and it is likely to reclaim the resistance level of $0.049 once again. However, in case the buyers were able to push the price near the upper boundary of the channel this time, the daily candlestick may close above this barrier, and the price could rally toward the resistance level of $0.050.
Hedera Hashgraph Price Prediction: HBAR Gets Ready for the Upside
According to the daily chart, the Hedera Hashgraph price is moving to cross above the upper boundary of the channel as the coin prepares to create an additional gain. The technical indicator Relative Strength Index (14) is crossing above the 50-level with the signal line pointing up to indicate a buy signal.
Meanwhile, if the buyers were able to push the price above the channel, the Hedera Hashgraph price may spike to hit the potential resistance levels of $0.055, $0.060, and $0.065 while crossing below the lower boundary of the channel could bring the coin to the supports at $0.040, $0.035, and $0.030 respectively.
When compares with Bitcoin, the Hedera Hashgraph is following a bullish surge, and it may swing high toward the upper boundary of the channel as crossing above it could locate the resistance level of 200 SAT and above. On the other hand, if the market price slides toward the lower boundary of the channel, it could reach the support level of 150 SAT and below.
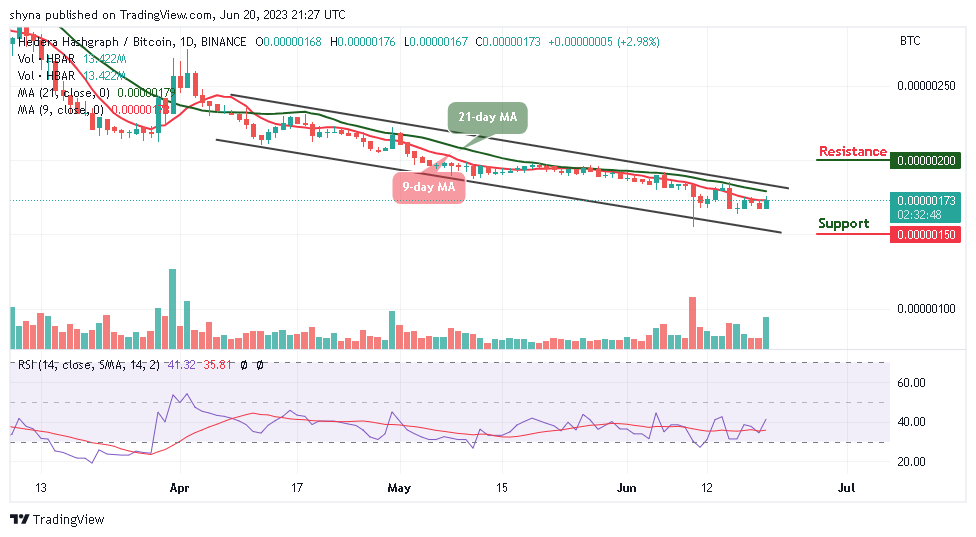
However, the technical indicator Relative Strength Index (14) is currently hovering above the 40-level as the signal line points to the north to confirm the bullish movement. Moreover, any further bullish movement may create additional gains within the channel.
Alternatives to Hedera Hashgraph
The Hedera Hashgraph price is heading toward the $0.050 resistance level. The bullish price seems hovering around this level and this is because of the immense struggle between bulls and bears above the moving averages. According to the Relative Strength Index (14), this is a sign of bullish activities in the market. However, to confirm the bullish recovery, the signal line may need to cross above the 60-level.
Nevertheless, research shows that PepeCoin is decreasing in value, and many have turned towards the Wall Street Memes Token. The project may become one of the biggest meme coins of the year. However, as the cryptocurrency market picks up steam again, investors are on the lookout for the next big meme coin and the perfect candidate for this title is Wall Street Memes Token ($WSM) tokens with close to $9 million been raised so far in the presale.
Read more:
- EOS Price Analysis: The Bulls Work Overtime to Raise Prices
- Ethereum Price Prediction: ETH/USD Likely to Keep Growing; Price Climbs Above $1200
- Litecoin Price Prediction: LTC/USD Grows 3.64% in a Day; Price Now Nears $63
CoinCodex - Our Recommended Crypto Research Platform

- Live Cryptocurrency Prices for Over 20,000 Coins
- Crypto Price Analysis with Popular Technical Indicators
- Crypto Price Predictions with Short and Long-Term Charts
- Historical Crypto Market Data Dating to 2010
- Crypto Portfolio, Profit Calculator, and Other Investment Tools
Join Our Telegram channel to stay up to date on breaking news coverage