Join Our Telegram channel to stay up to date on breaking news coverage
ETH Price Prediction – January 22
After touching the daily low of $1039, the price of Ethereum is seen recovering to the upside at the $1238 level.
ETH/USD Market
Key Levels:
Resistance levels: $1400, $1500, $1600
Support levels: $900, $800, $700
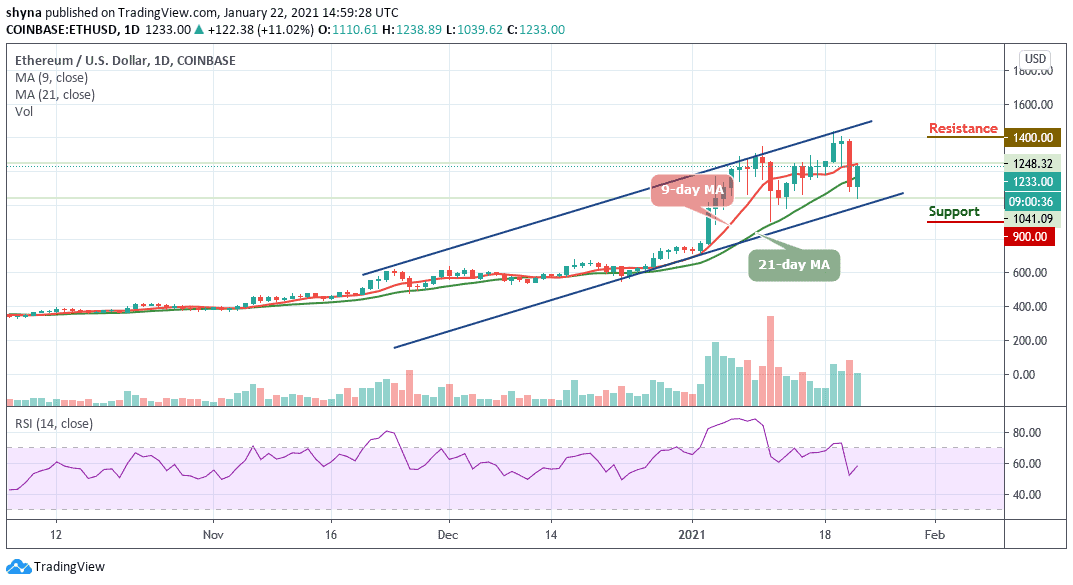
ETH/USD is seen trading towards the resistance level of $1250 level within the ascending channel. Yesterday’s decline has been largely attributed to the fact that Ethereum plummeted pretty significantly. More so, ETH/USD is moving above the 21-day moving average but it can rise higher and break above the 9-day moving average at around $1250. If ETH/USD falls and drops beneath the support of $1100, the coin may turn bearish.
Where is ETH Price Going Next?
If the sellers begin to add downward pressure to the crypto, initial support is expected at $900. Beneath this, support can be found at $800 and $700. On the other hand, if the bulls can defend the $225 level and allow ETH to rebound, an initial resistance may be located at $1230. Above this, additional resistance is expected at $1400, $1500, and $1600 levels.
Moreover, the technical indicator RSI (14) is about to cross above the 60-level showing that the bullish momentum may step back into the market. If the technical indicator manages to make a quick turn-back, then the bulls stand a chance to allow Ethereum to rebound. However, if it penetrates beneath, the cryptocurrency may resume a downward spiral.
Against Bitcoin, the market price remains above the 9-day and 21-day moving averages as it is currently trading at 0.037 BTC and the bulls are pushing the market price above towards the upper boundary of the channel. Meanwhile, if the market begins to drop below the moving averages, the next key supports may likely be at 0.032 BTC and below.
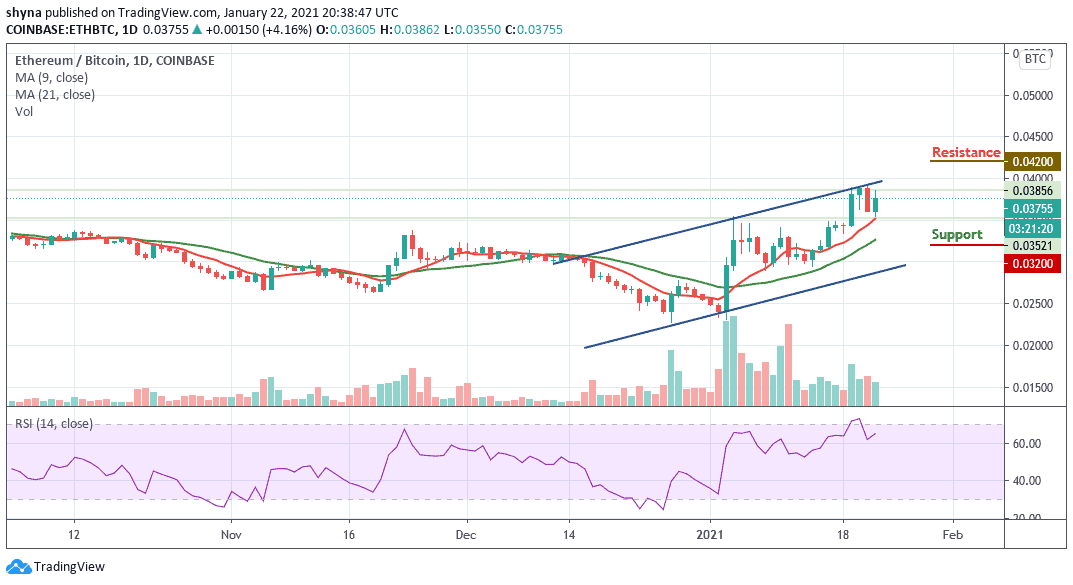
However, considering the upside, the bullish movement may push the market price above the channel, when this is done, the resistance level of 0.042 BTC and above may be visited. Meanwhile, the RSI (14) is moving back towards the upside and this indicates a bullish momentum in the market.
Join Our Telegram channel to stay up to date on breaking news coverage