
Join Our Telegram channel to stay up to date on breaking news coverage
The Hedera Hashgraph price prediction is getting ready to trade above the resistance level of $0.070 as the market moves sideways.
Hedera Hashgraph Prediction Statistics Data:
- Hedera Hashgraph price now – $0.065
- Hedera Hashgraph market cap – $2 billion
- Hedera Hashgraph circulating supply – 30.6 billion
- Hedera Hashgraph total supply – 50 billion
- Hedera Hashgraph Coinmarketcap ranking – #32
HBAR/USD Market
Key Levels:
Resistance levels: $0.090, $0.100, $0.110
Support levels: $0.045, $0.035, $0.025
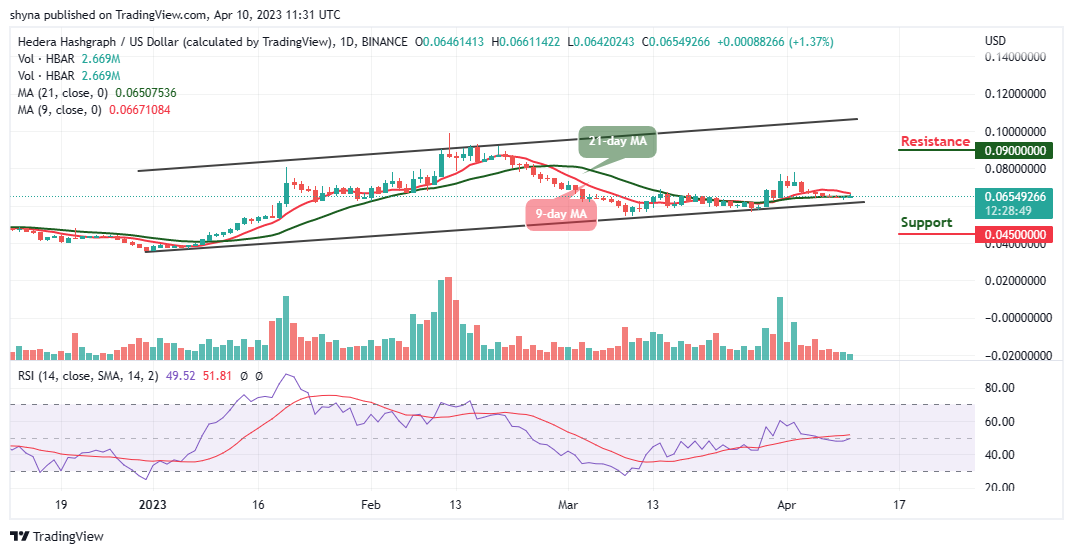
HBAR/USD is currently ranging around $0.065, and it is likely to climb above the 9-day moving average. Now, the Hedera Hashgraph price has been moving sideways, as the coin is struggling to cross above the moving averages.
Hedera Hashgraph Price Prediction: Hedera Hashgraph (HBAR) May Keep Moving Sideways
According to the daily chart, if the Hedera Hashgraph price crosses above the 9-day moving average; it could hit the nearest resistance level of $0.070. However, a successful break above this level could open the doors for an additional increase to the $0.080 level. In the meantime, any further bullish movement could push the coin to the potential resistance levels of $0.090, $0.100, and $0.110.
Moreover, as the technical indicator Relative Strength Index (14) remains below the 50-level, the nearest support could be found at the $0.050 level. If there is a bearish break below this support, HBAR/USD could test another support. However, any further losses could lead the price toward the support levels of $0.045, $0.035, and $0.025.
When compares with Bitcoin, the Hedera Hashgraph price is ranging as the coin hovers around 231 SAT. Therefore, if the price crosses above the 9-day moving average, there is a possibility that additional resistance levels may be created in the long term as the next resistance level is close to the 200 SAT. Moreover, if the price crosses below the lower of the channel, it could hit the critical support at 150 SAT and below.
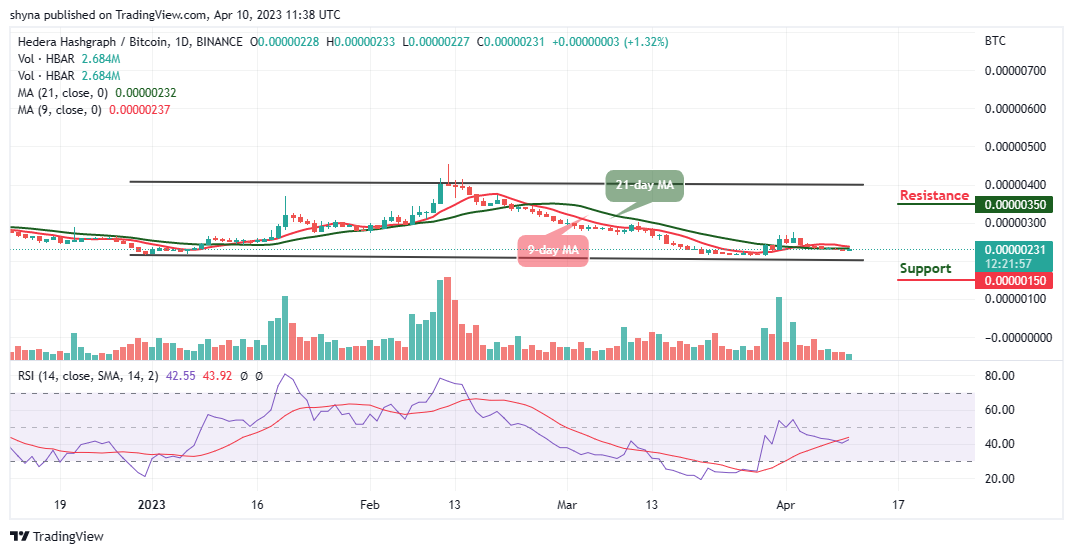
However, a bullish movement toward the upper boundary of the channel may play out and the potential resistance level could be located at 350 and above as the technical indicator Relative Strength Index (14) moves above the 40-level, which suggests an upward movement.
Hedera Hashgraph Alternatives
At the moment, the Hedera Hashgraph price is hovering around $0.086 with weak bullish momentum supported by slightly positive technical levels. Therefore, any further bullish movement could push the coin toward the upper boundary of the channel. However, the Love Hate Inu’s voting platform rewards those that are willing to stake tokens and contribute to the community. On this platform, users can vote on the user interface platform after staking LHINU tokens as almost $3.5 million has been raised so far in the presale.
Join Our Telegram channel to stay up to date on breaking news coverage