
Join Our Telegram channel to stay up to date on breaking news coverage
The Hedera Hashgraph price prediction needs to cross above the $0.080 resistance level quickly to deny the bears the opportunity to step back.
Hedera Hashgraph Prediction Statistics Data:
- Hedera Hashgraph price now – $0.071
- Hedera Hashgraph market cap – $2.1 billion
- Hedera Hashgraph circulating supply – 30.1 billion
- Hedera Hashgraph total supply – 50 billion
- Hedera Hashgraph Coinmarketcap ranking – #30
HBAR/USD Market
Key Levels:
Resistance levels: $0.100, $0.110, $0.120
Support levels: $0.045, $0.035, $0.025
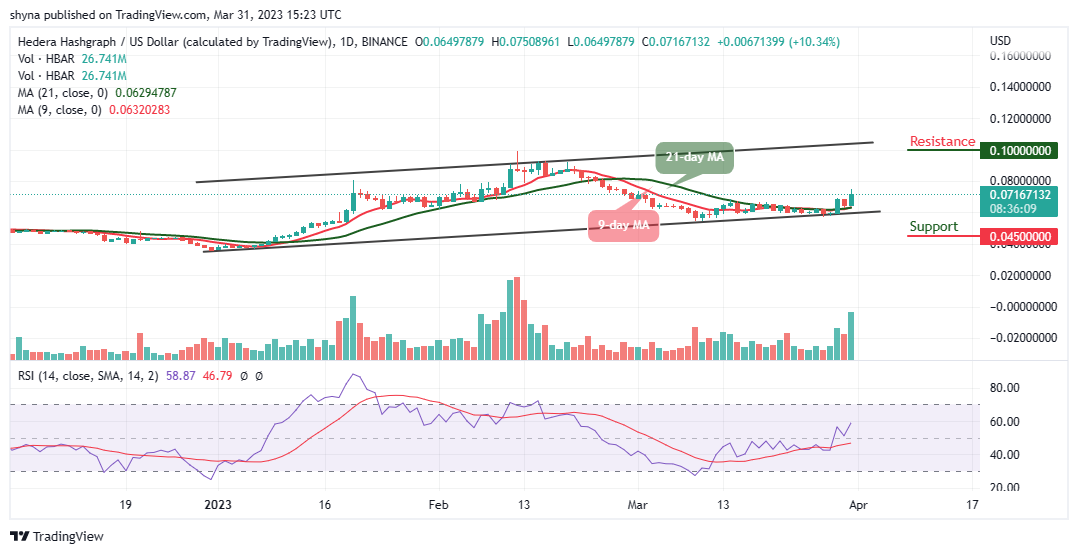
HBAR/USD is currently hovering above $0.070 as the coin prepares to gain more bullish signals. The movement to the upside may not allow the coin to bow to the selling activity going on in the market. However, Hedera Hashgraph (HBAR) is trading above the 9-day and 21-day moving averages. In the short term, bearish momentum is very likely especially if the bulls fail to hold the price above the $0.080 level.
Hedera Hashgraph Price Prediction: Would Hedera Hashgraph (HBAR) Continue Higher?
The Hedera Hashgraph price may need to move near the upper boundary of the channel to confirm the bullish trend but may need to remain above the 9-day and 21-day moving averages. Meanwhile, if the sellers bring the price lower, traders can expect very strong support at $0.060; this could then be followed up with another support at $0.050. If the bears push further below, additional supports may be located at $0.045, $0.035, and $0.025.
In the meantime, if the buyers continue with the bullish movement, the first level of resistance could be found at $0.080. Further bullish movement could hit the potential resistance levels at $0.100, $0.110, and $0.120, while the Relative Strength Index (14) moves to cross above the 60-level to indicate a bullish movement.
Against Bitcoin, the Hedera Hashgraph price keeps trading above the 9-day ad 21-day moving averages as the market heads to the upside. HBAR/BTC is currently trading at 252 SAT but if the price drops and moves toward the lower boundary of the channel, the next key support may come at 140 SAT and below.
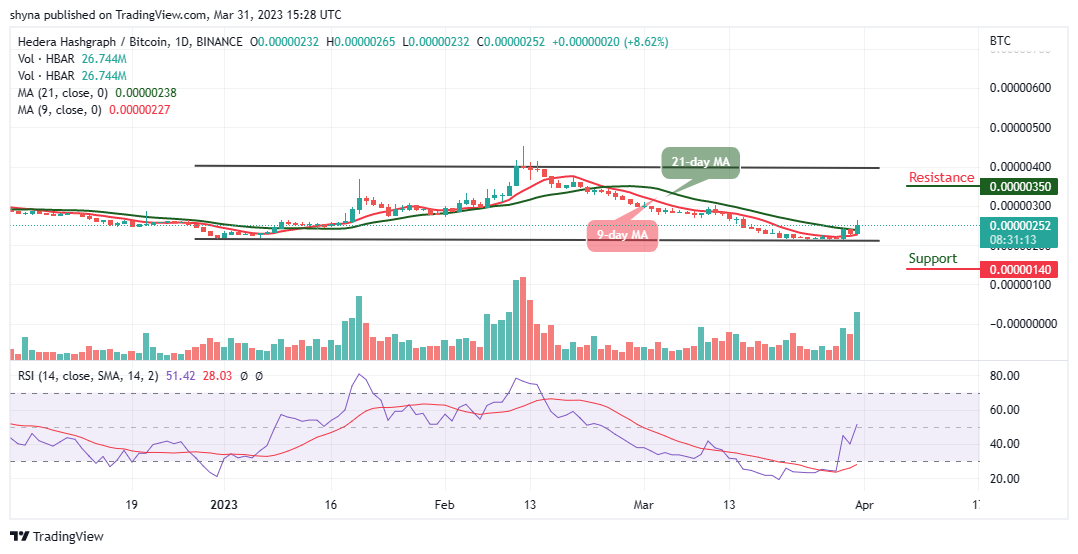
However, a continuous bullish movement could push the market toward the channel, a break above this barrier may enable the Hedera Hashgraph price to reach the resistance level of 350 SAT and above as the Relative Strength Index (14) moves to cross above the 50-level, which shows that the market might experience further bullish movement.
Alternatives to Hedera Hashgraph
The Hedera Hashgraph (HBAR) is at the moment trading above the moving averages and the coin may need to stay above this barrier to keep the upward movement. Meanwhile, if the buyers were able to increase the buying pressure, the Hedera Hashgraph could reach higher levels. Nevertheless, the presale for the Love Hate Inu (LHINU) token is selling fast and about $2.5 million has been raised so far. Traders are therefore encouraged to act fast before the expiration of the presale.
Join Our Telegram channel to stay up to date on breaking news coverage