
Join Our Telegram channel to stay up to date on breaking news coverage
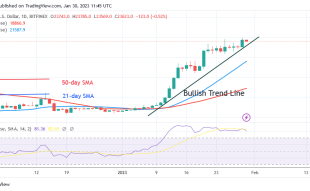
GMX price blasted past a key resistance zone on January 29 confirming a highly bullish technical setup. The price closed the day on Sunday at $61.55, the best daily close since the token was listed on Binance in October. The ongoing correction is a sign that investors are taking profits at the higher levels but this may be short-lived as it provides an opportunity to buy GMX at a discount driving the price further up.
Flynt Finance Sparks Investor Interest In GMX
The GMX platform has undergone rapid growth over the past few months rising 56% since the New Year. With a total trading volume of over $80.3 billion, traders can leverage the Decentralized Exchange (DEX) up to 50x. The total value locked (TVL) on GMX has grown by more than 300% to new record highs of $519.05 million at press time. GMX makes up 36% of Arbitrum network’s overall TVL of $1.23 billion.
Total Value Locked on GMX
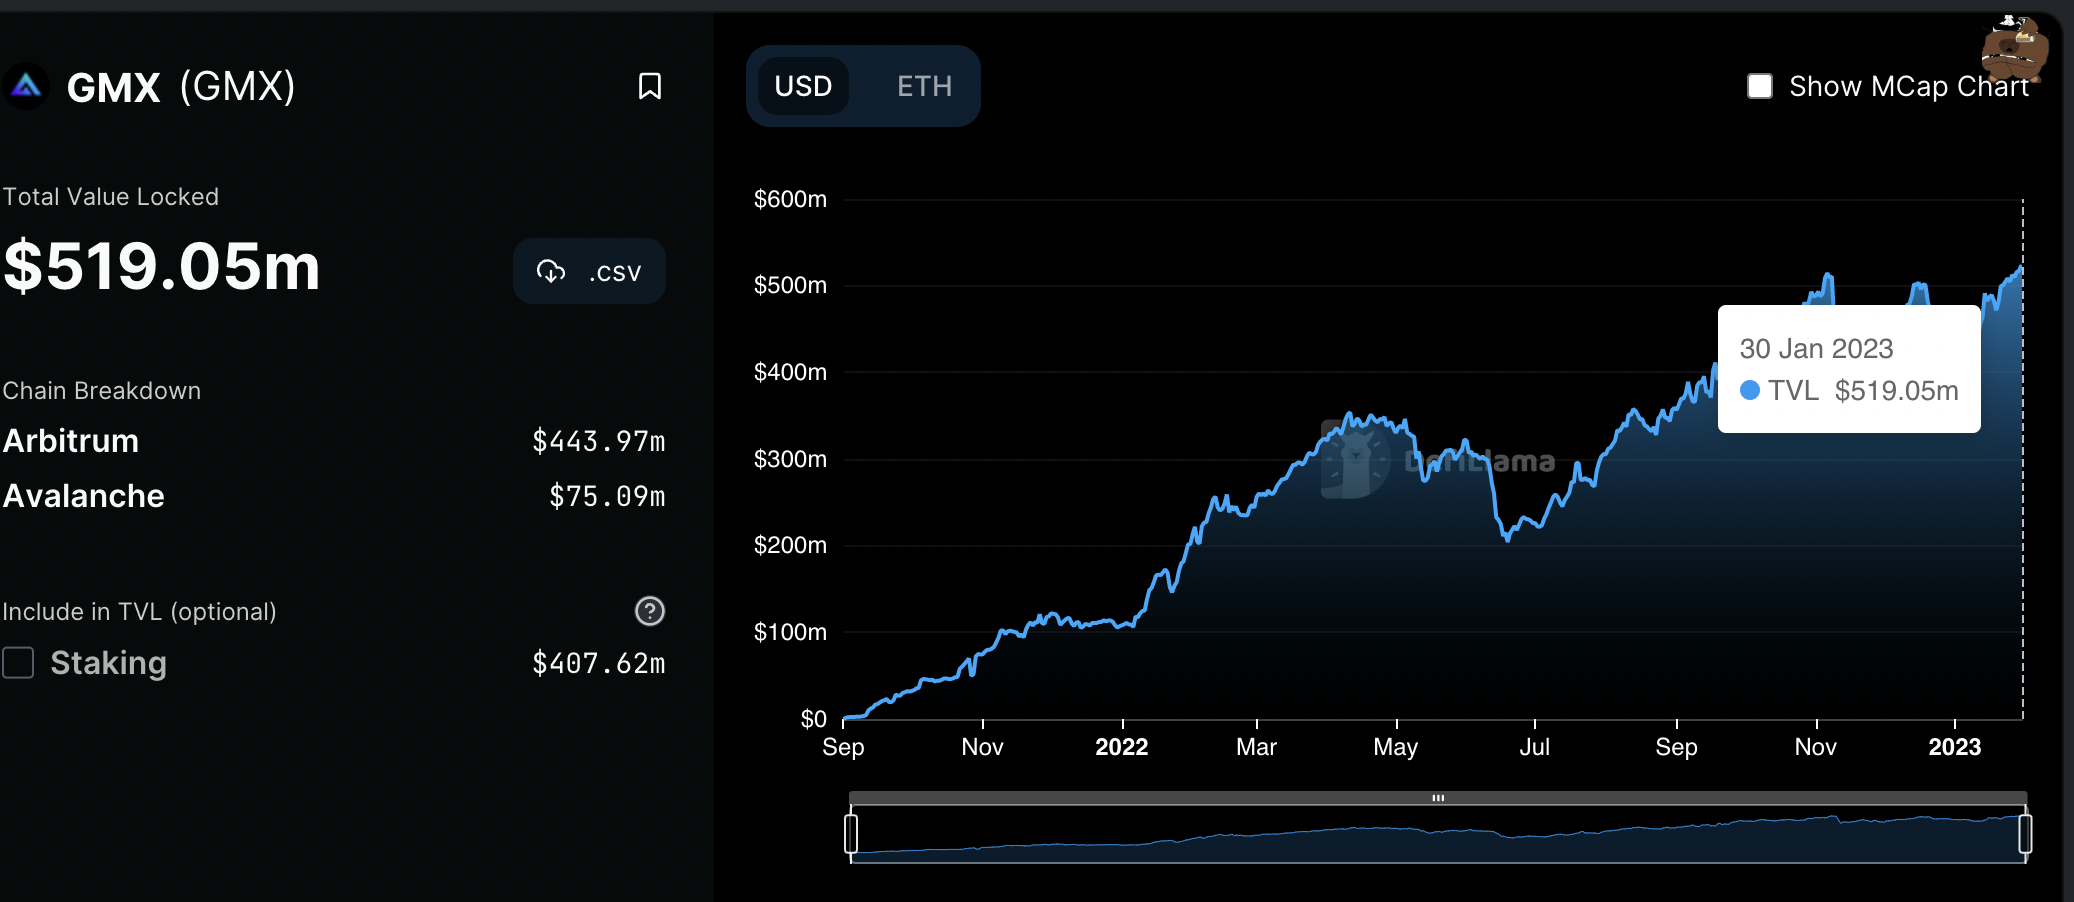
The increase in GMX’s TVL has been attributed to the growing number of users on the platform, who have spiked 120% since January 1. This has also led to an increase in transaction volume and total network fees earned on the platform.
One of the most critical factors driving the growth in the number of users is the increased investor interest. This is usually triggered by developments on the platform, updates, and partnerships or collaborations. Perhaps one of the things driving investor interest in GMX is the recent news that Flynt Finance, an upcoming crypto wealth management platform, had introduced a new investment strategy for its clients using GMX’s GLP.
GMX:GLP Delta-neutral strategy fully backtested by @0xTinkerer
Asset : USDC
Returns : 18.96%
Max drawdown : -3.52%NFA
🧵0/16— Flynt Finance 🫐 (@flyntfinance) January 18, 2023
Flynt’s USDC delta-neutral strategy will use the DEX’s liquidity pool to provide a stable stream of income for its users by reducing exposure to extreme volatility in the prices of the underlying assets. This will be made possible while earning high returns through fees generated
These positive fundamentals and on-chain insights trigger increasing investor interest in GMX, giving a positive outlook.
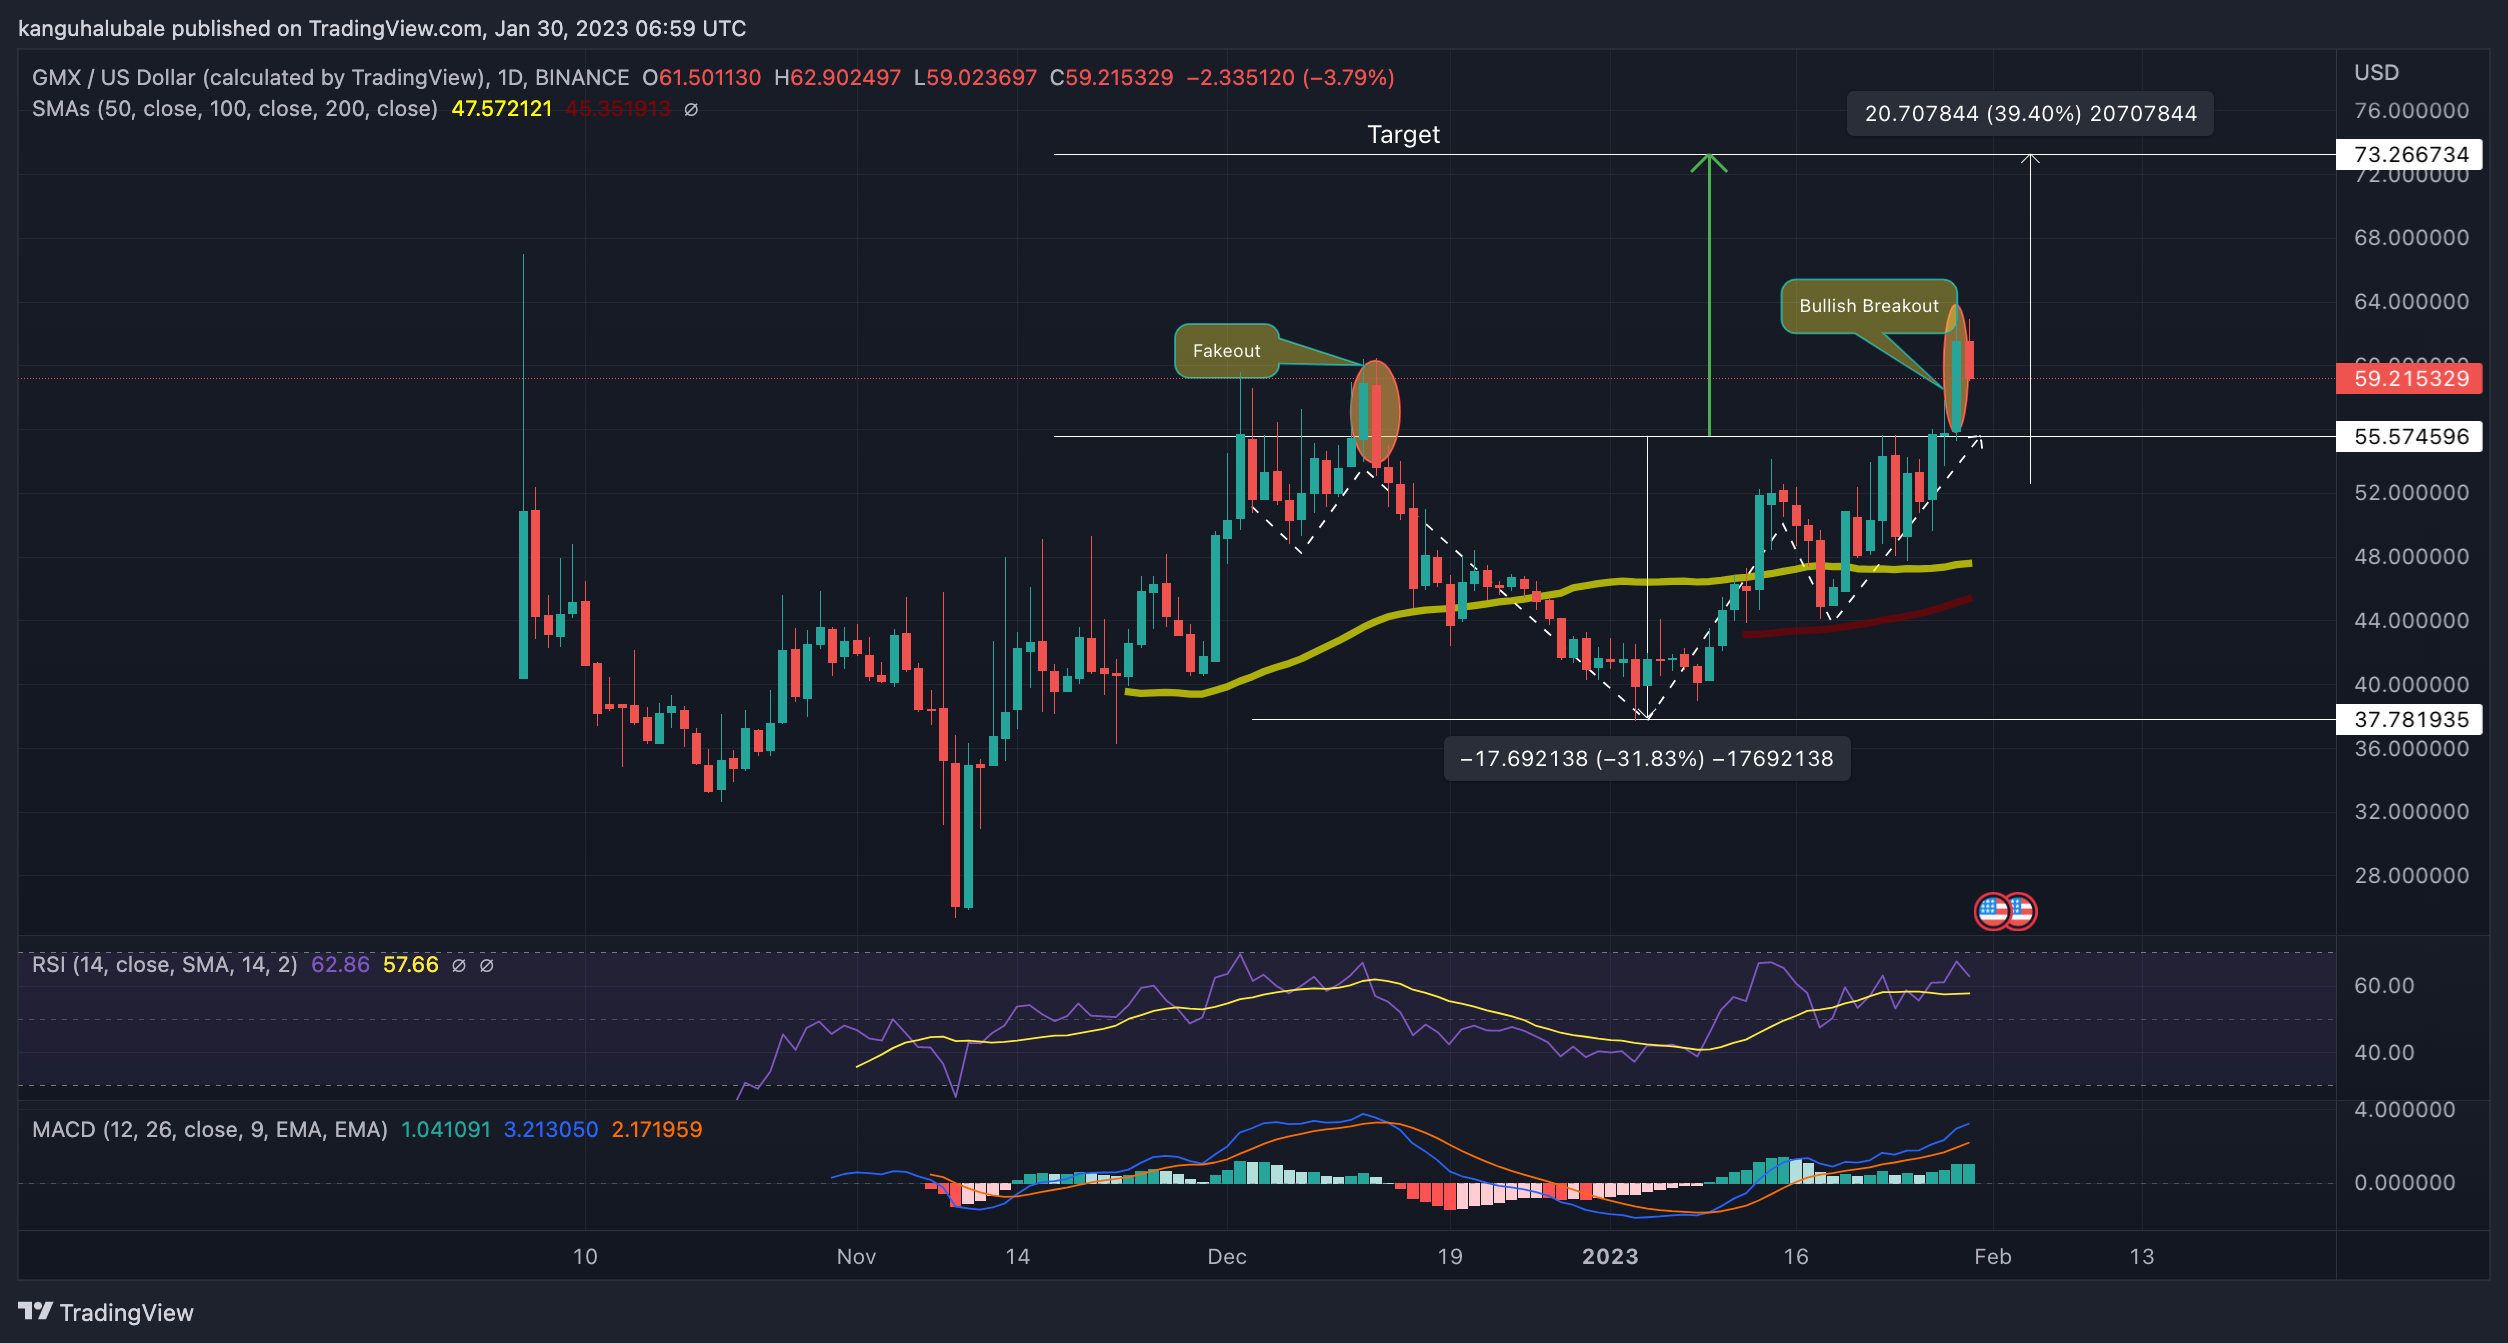
GMX Price Confirms An Inverse Head and Shoulders Chart Pattern
The GMX price was trading in an inverse head-and-shoulders chart pattern as buyers focused on achieving a bullish breakout that would send the token ballistic. This was to happen once the price closed above the technical creation’s neckline at $55.5, confirming the pattern.
At press time, the DEX token was trading just below the $60 psychological level escaping from the prevailing chart pattern over the weekend. This set the token up for massive gains toward the technical target of the inverse H&S set up at $73.2, as shown on the daily chart below.
For this to happen, the bulls must ensure a daily candlestick close above the $60 barrier and Sunday’s high above $64. If this happens, it would suggest that the buyers are strong enough to finally lift the price past this stubborn level. Note that the price was turned away from this supplier congestion zone in mid-December in what turned out to be a fake-out (bull-trap) with the GMX going on to tumble 38% towards the head’s tip at $37.7.
GMX/USD Daily Chart
Apart from the technical pattern, other indicators support GMX’s positive outlook. To begin with, the price is trading above the major moving averages: the 50-day simple moving average (SMA) at $47.5 and the 100-day SMA at $45.35. These provide robust defense lines where buyers can regroup on the downside before kickstarting another uptrend.
In addition, the moving average divergence convergence (MACD) indicator was moving upward above the zero line in the positive region. The call to buy GMX which was sent on January 8 when the MACD line (blue) crossed over the signal line (orange) was still intact, an indication that the price action still favored the upside.
Moreover, the relative strength index (RSI) is still positioned above the midline at $67. This suggested that there were still more buyers than sellers in the market, adding credence to the bullish outlook.
Conversely, the RSI was facing downward away from the overbought zone. This showed that the uptrend was losing strength and that the ongoing correction may continue in the near term. As such, failure to move above the roadblock at $60 would signal weakness amongst the buyers.
If this happens, there could be a pullback below the inverse H&S neckline at $55.5 with GMX dropping first toward the $50 psychological level and later to the 100-day SMA $45. In highly bearish desperate scenarios, the buyers may retreat lower toward the tip of the head at $37.78, completely invalidating the positive narrative.
Related News:
- Meta Masters Guild: The Next Big Thing in Play-to-Earn Crypto Gaming, Invest Now, Price Set to pump 30% Today
- Tech Hustler Reviews Fight Out | Earn Crypto For Real Workouts In Real Life
- How To Buy Meta Masters Guild
Best Wallet - Diversify Your Crypto Portfolio

- Easy to Use, Feature-Driven Crypto Wallet
- Get Early Access to Upcoming Token ICOs
- Multi-Chain, Multi-Wallet, Non-Custodial
- Now On App Store, Google Play
- Stake To Earn Native Token $BEST
- 250,000+ Monthly Active Users
Join Our Telegram channel to stay up to date on breaking news coverage