Join Our Telegram channel to stay up to date on breaking news coverage
The Fantom price prediction shows that FTM shoots to the upside as the bulls take the coin to higher levels.
Fantom Prediction Statistics Data:
- Fantom price now – $0.262
- Fantom market cap – $733 million
- Fantom circulating supply – 2.7 billion
- Fantom total supply – 3.1 billion
- Fantom Coinmarketcap ranking – #48
FTM/USD Market
Key Levels:
Resistance levels: $0.400, $0.420, $0.440
Support levels: $0.120, $0.100, $0.080
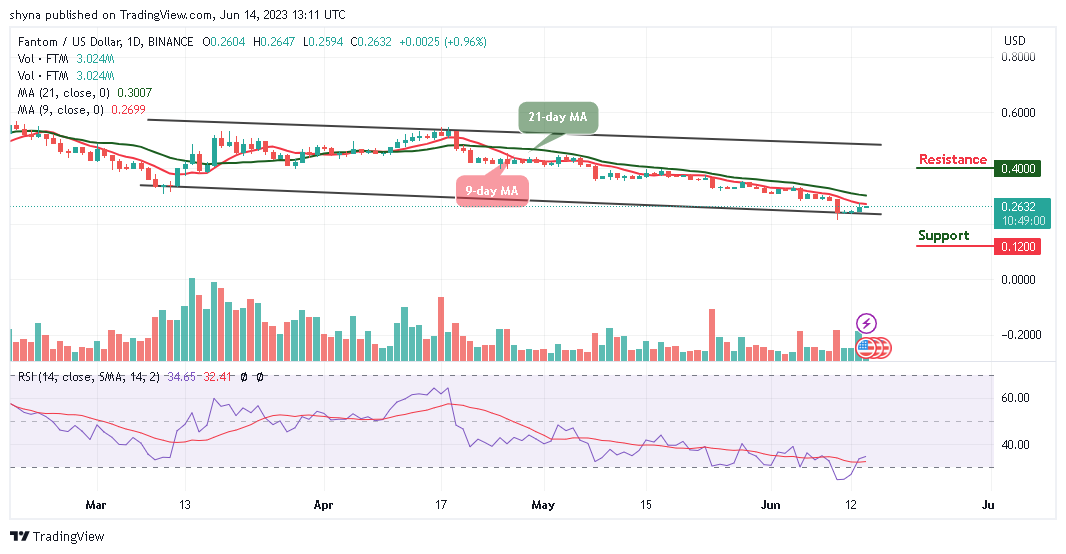
FTM/USD is trading above $0.260 as the coin moves to cross above the 9-day and 21-day moving averages to touch the resistance level of $0.270. The coin may continue to move upward if the price successfully crosses above the moving averages. Meanwhile, the Fantom price could reach the resistance level of $0.300 if the bulls focus on the upward trend.
Fantom Price Prediction: FTM/USD Gets Ready for a Spike
The Fantom price may spike to the positive side should the 9-day moving average cross above the 21-day moving average. Meanwhile, the technical indicator Relative Strength Index (14) is also confirming the bullish movement as the signal line faces the north.
Therefore, there is a higher chance that the coin may find the potential resistance levels at $0.400, $0.420, and $0.440. On the contrary, if the coin slides and crosses below the lower boundary of the channel, it could bring the coin to touch the critical supports at $0.120, $0.100, and $0.080 respectively.
When compares with Bitcoin, Fantom may create additional gains as it moves to cross above the 9-day moving average. However, if the bullish movement continues, the next level of resistance may come to play, and this may cause FTM/BTC to locate the key resistance at 1300 SAT and above.
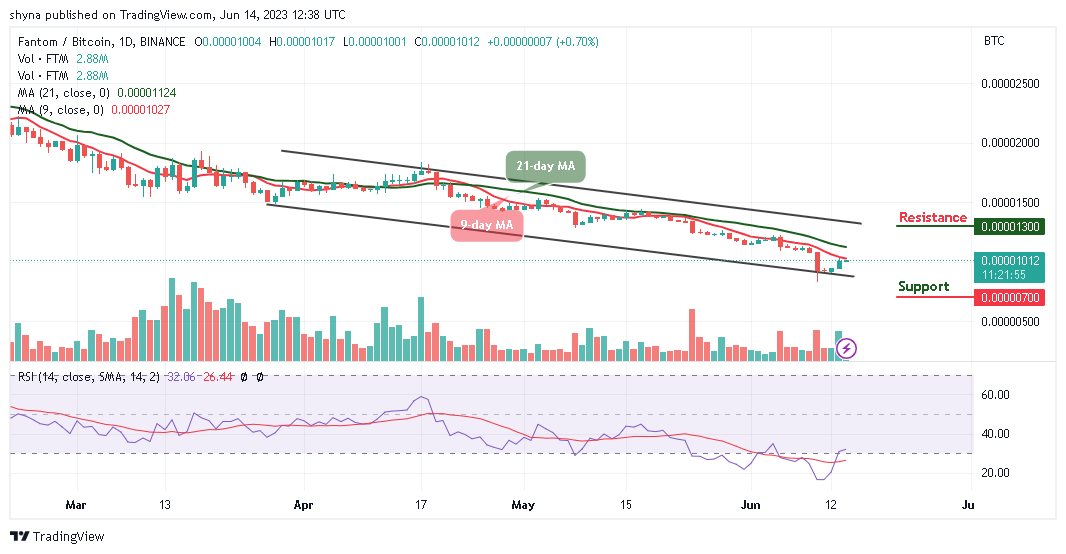
On the downside, FTM/BTC could face support at 900 SAT. Beneath this, the critical support level could be located at 700 SAT and below. At the moment, the 9-day MA remains below the 21-day MA and the technical indicator Relative Strength Index (14) is recovering from the oversold region, but any spike above the 40-level may increase the bullish movement within the channel.
Fantom Alternatives
The Fantom price may continue to refresh to the upside as the coin currently trades at $0.262 with a bullish crossover above the 9-day moving average. Today, the Fantom price is likely to face the upper boundary of the channel as higher resistance may come in the next positive direction. Meanwhile, Wall Street Memes was created to provide the Wall Street Memes community with a token that connects them and helps them achieve wealth. In the ongoing presale, almost $7 million has been raised so far as interested investors are expected to act fast.
Read more:
- Ripple Price Prediction: XRP/USD Stable Above $0.280 Following Bitcoin’s Latest Gains
- Bitcoin Price Prediction: BTC/USD Breaks Above $8,000; Gains Over 7.41% Within 24 Hours
New OKX Listing - Wall Street Memes

- Established Community of Stocks & Crypto Traders
- Featured on Cointelegraph, CoinMarketCap, Yahoo Finance
- Rated Best Crypto to Buy Now In Meme Coin Sector
- Team Behind OpenSea NFT Collection - Wall St Bulls
- Tweets Replied to by Elon Musk
Join Our Telegram channel to stay up to date on breaking news coverage