Join Our Telegram channel to stay up to date on breaking news coverage
XRP Price Prediction – February 9
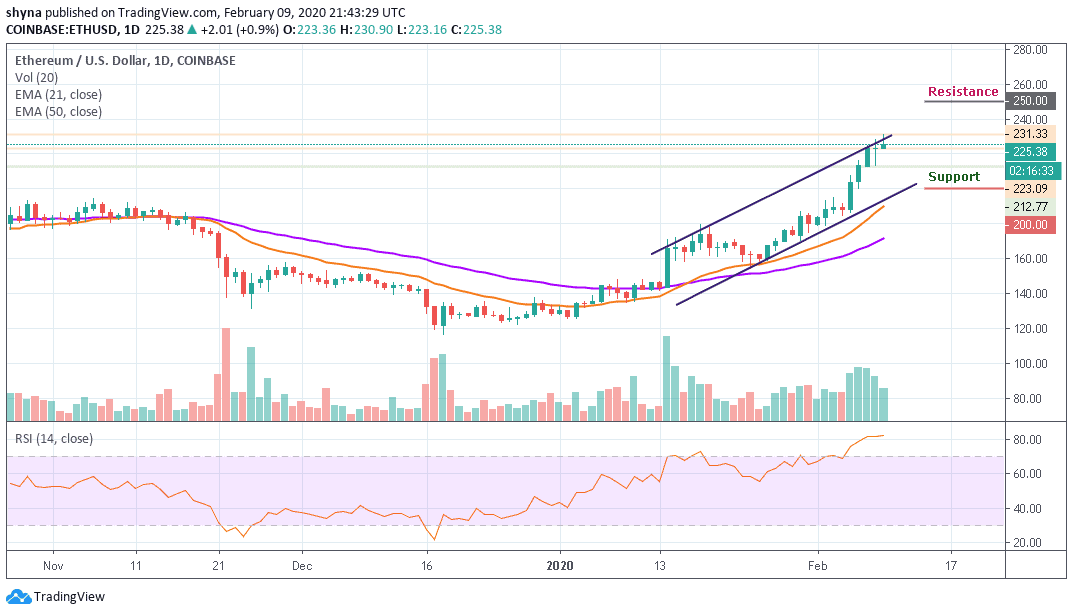
The price of XRP/USD saw a small 2.2% increase over the past 24 hours as the cryptocurrency trades at $0.283.
XRP/USD Market
Key Levels:
Resistance levels: $0.310, $0.320, $0.330
Support levels: $0.250, $0.240, $0.230
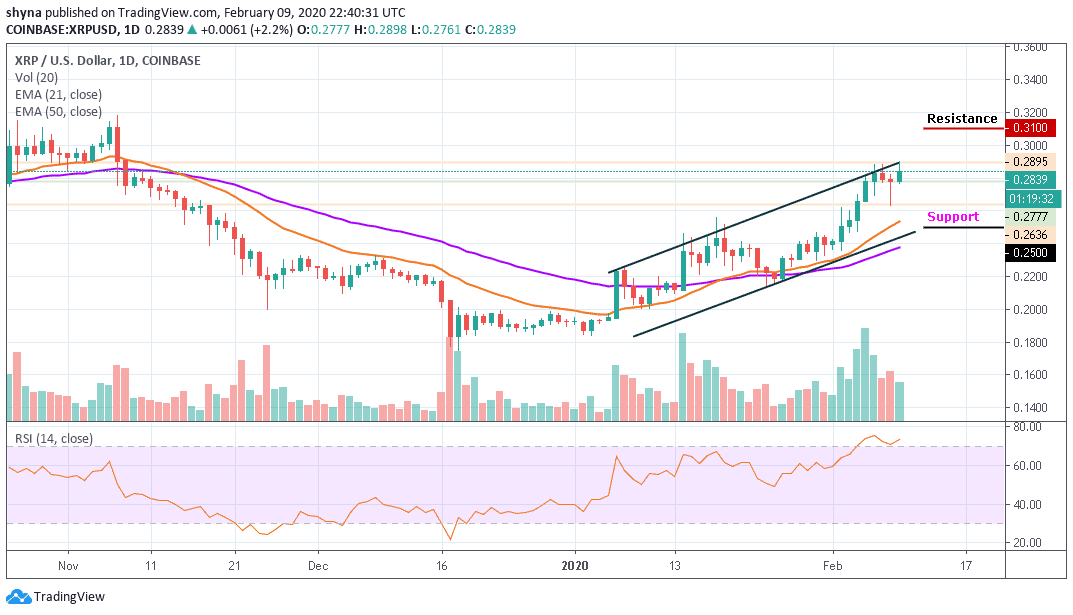
At the opening of the market today, XRP/USD continued to find resistance at the upper boundary of the ascending channel as well as at $0.289. More so, the Ripple (XRP) continues to remain strongly supported with the support level of yesterday at $0.277 and may need to fall beneath this to head lower.
In addition, XRP/USD must break above the resistance at $0.290 to continue its bullish drive higher. However, should in case the price falls beneath $0.260, the market may likely turn neutral, and a drop beneath the 21 periods EMA at the lower boundary of the ascending channel could turn it bearish.
Moreover, as the technical indicator RSI (14) remains within the overbought territory, traders should keep eye on the $0.290 and $0.300 before creating a new bullish trend at the resistance levels of $0.310, $0.320 and $0.330. In other words, if the price falls below the $263 support, a bearish breakout may trigger more selling pressure for traders, which might cause the price to retest $0.250 and could further drop to $0.240 and $0.230 support levels respectively.
Against Bitcoin, the Ripple (XRP) is consolidating within the channel, moving towards the south which may likely break below the 21 and 50 periods EMA. Meanwhile, should in case a rebound comes to focus, the coin may face the upward trend to cross the upper boundary of the channel and the bullish continuation may take it to the resistance levels of 3000 SAT and above.
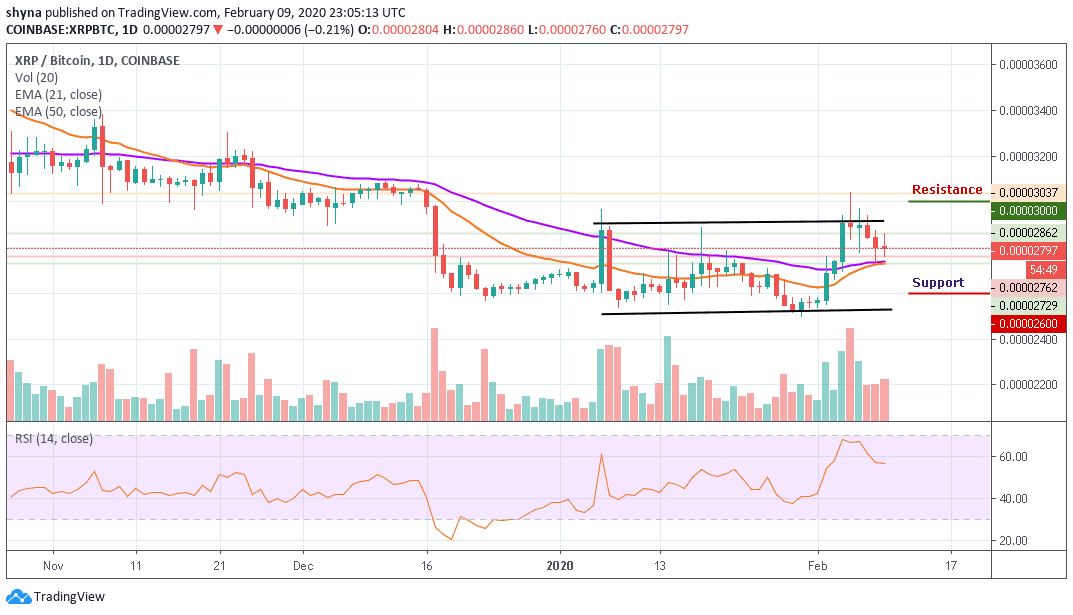
Meanwhile, looking at the daily chart, if the bulls couldn’t re-energized to halt the selling pressure in the market, then XRP/BTC may likely follow the downward trend towards the lower side of the channel and the nearest support levels for the coin lies at 2600 SAT and below. More so, the RSI (14) moves below 60-level, which indicates more bearish signals.
Please note: Insidebitcoins.com is not a financial advisor. Do your research before investing your funds in any financial asset or presented product or event. We are not responsible for your investing results.
Join Our Telegram channel to stay up to date on breaking news coverage