Join Our Telegram channel to stay up to date on breaking news coverage
The Fantom price prediction may cross above the upper boundary of the channel as the coin moves to create additional gains.
Fantom Prediction Statistics Data:
- Fantom price now – $0.49
- Fantom market cap – $1.37 billion
- Fantom circulating supply – 2.78 billion
- Fantom total supply – 3.17 million
- Fantom Coinmarketcap ranking – #42
FTM/USD Market
Key Levels:
Resistance levels: $0.65, $0.70, $0.75
Support levels: $0.35, $0.30, $0.25
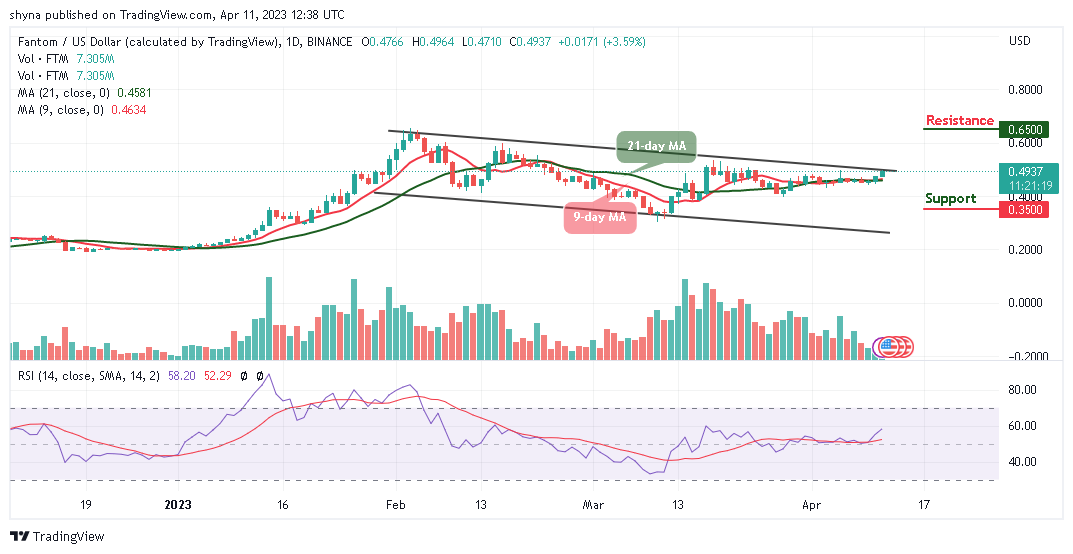
Looking at the daily chart, FTM/USD continues to trade above the 9-day and 21-day moving averages as the coin moves to cross above the channel. Today, an early trading session makes the Fantom price touch the resistance level of $0.49 level as the gears up for additional gains.
Fantom Price Prediction: Would Fantom (FTM) Break to the Upside?
The Fantom price may stay above the 9-day and 21-day moving averages, and if the resistance of $0.50 gives way, the bull run may come to focus, and the coin may create an additional bullish trend. Therefore, if the coin reaches the resistance level of $0.055, this could further strengthen the market to $0.65, $0.70, and $0.75 resistance levels.
On the downside, a lower possible swing may likely retest to the previous support below the 9-day and 21-day moving averages. However, if the bears manage to fuel the market, traders may expect a further drop to the support levels of $0.35, $0.30, and $0.25. On the other hand, the technical indicator Relative Strength Index (14) is now moving to cross above the 60-level, indicating that the market may continue to move upward.
Compared with Bitcoin, the Fantom price is yet to cross above the moving averages in other to reach the resistance level of 1700 SAT. However, with the look of things, the bulls are attempting to push the coin above the upper boundary for the channel so that the market price may end up closing above it.
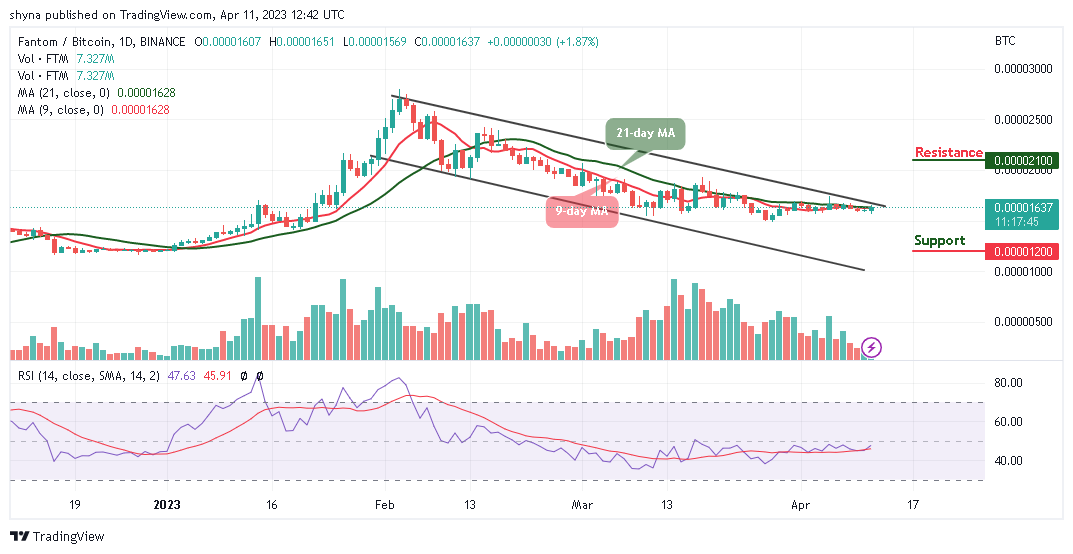
Meanwhile, if FTM/BTC heads to the downside, it could refresh lows under 1500 SAT, and a possible bearish continuation could meet the major support at 1200 SAT and below, but if the coin spikes above the channel, it could hit the potential resistance at 2100 SAT and above. However, the technical indicator Relative Strength Index (14) is moving in the same direction, suggesting sideways movement for the coin.
Alternatives to Fantom
The Fantom price is likely to increase the bullish movement if the price increases and crosses above the upper boundary of the channel. At the moment, the technical indicator Relative Strength Index (14) is likely to cross above the 60-level; and it could send bullish signals into the market to encourage more buyers. Meanwhile, Love Hate Inu (LHINU) keeps making waves in the market. This platform allows you to create a recurring revenue stream from your opinions on the most hot-button issues. In the ongoing presale, almost $4 million has been raised so far as interested investors are expected to act fast.
Join Our Telegram channel to stay up to date on breaking news coverage