Join Our Telegram channel to stay up to date on breaking news coverage
The Fantom price prediction shows that FTM may continue to follow the bullish movement as the coin hovers around the $0.45 resistance level.
Fantom Prediction Statistics Data:
- Fantom price now – $0.45
- Fantom market cap – $1.27 billion
- Fantom circulating supply – 2.78 billion
- Fantom total supply – 3.17 million
- Fantom Coinmarketcap ranking – #44
FTM/USD Market
Key Levels:
Resistance levels: $0.60, $0.65, $0.70
Support levels: $0.30, $0.25, $0.20
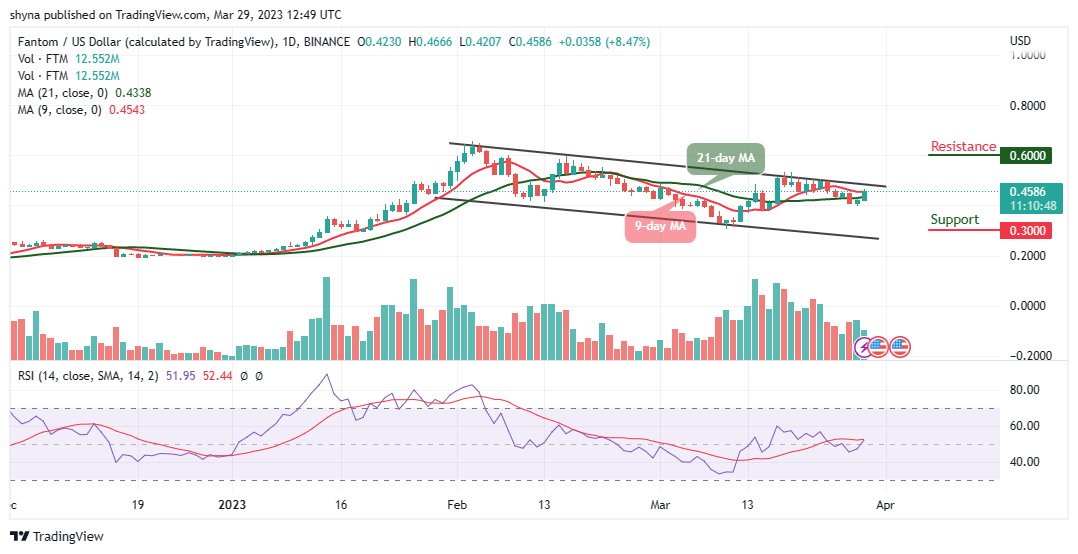
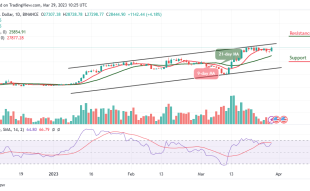
Looking at the daily chart, FTM/USD is crossing above the 9-day and 21-day moving averages as it could hit $0.50 in the next positive direction. However, the Fantom price is currently trading at $0.45, although the coin touches the daily high of $0.46 resistance level after crossing above the 9-day moving average, it could probably retest $0.42 before it rises again.
Fantom Price Prediction: FTM/USD May Go Bullishly
The Fantom price is beginning to follow the upward movement and a break above the $0.50 level could encourage more buyers to increase their entries, crossing above the upper boundary of the channel could push the price to the resistance levels of $0.60, $0.65, and $0.70. On the downside, if the price breaks and heads toward the lower boundary of the channel, the sell-off could gain traction with the next focus below the $0.40 support.
Moreover, if the coin breaks below the about support, the downside pressure may increase while the next supports may be located at $0.30, $0.25, and $0.20 respectively. On the other hand, the technical indicator Relative Strength Index (14) is crossing above the 50-level, indicating bullish signals.
When compares with Bitcoin, the Fantom price is still below the 9-day and 21-day moving averages. Meanwhile, a daily close above the resistance level of 1800 SAT could encourage the bulls to extend the rally towards 2500 SAT and above. In other words, a close below the lower boundary of the channel could reverse the Fantom price direction towards the daily support at 1000 SAT.
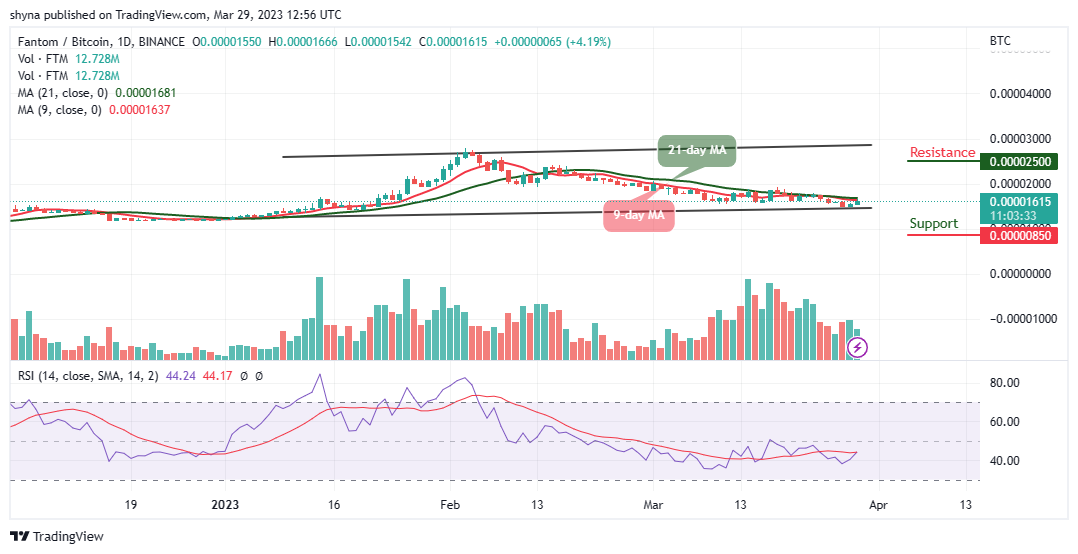
However, any further bearish movement could take the coin to the support of 850 SAT and below. Meanwhile, there is a possibility that FTM/USD may continue the bullish trend as the technical indicator Relative Strength Index (14) moves to cross above the 50-level, suggesting bullish movement.
Alternatives to Fantom
At the time of writing, the Fantom price is trading bullishly as the coin prepares to hit the resistance level of $0.50. Meanwhile, the Fantom price may remain on the positive side should the 9-day moving average stays above the 21-day moving average. Nevertheless, Love Hate Inu (LHINU) keeps making waves in the market and using its innovative ‘Vote-to-Earn’ (V2E) mechanism, this platform allows you to create a recurring revenue stream from your opinions on the most hot-button issues. Therefore, LHINU tokens are in presale, almost $2.5 million has been raised so far.
Join Our Telegram channel to stay up to date on breaking news coverage