Join Our Telegram channel to stay up to date on breaking news coverage
The Fantom price prediction may continue to show a bullish movement if the market could stable above the moving averages.
Fantom Prediction Statistics Data:
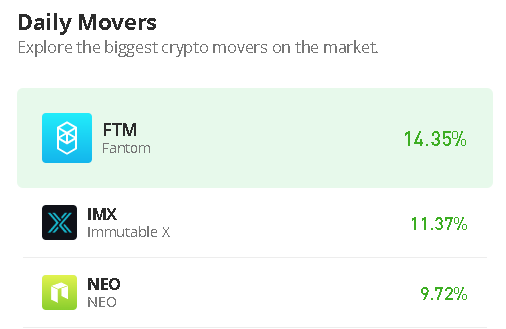
- Fantom price now – $0.46
- Fantom market cap – $1.27 billion
- Fantom circulating supply – 2.78 billion
- Fantom total supply – 3.17 million
- Fantom Coinmarketcap ranking – #43
FTM/USD Market
Key Levels:
Resistance levels: $0.68, $0.70, $0.72
Support levels: $0.26, $0.24, $0.22
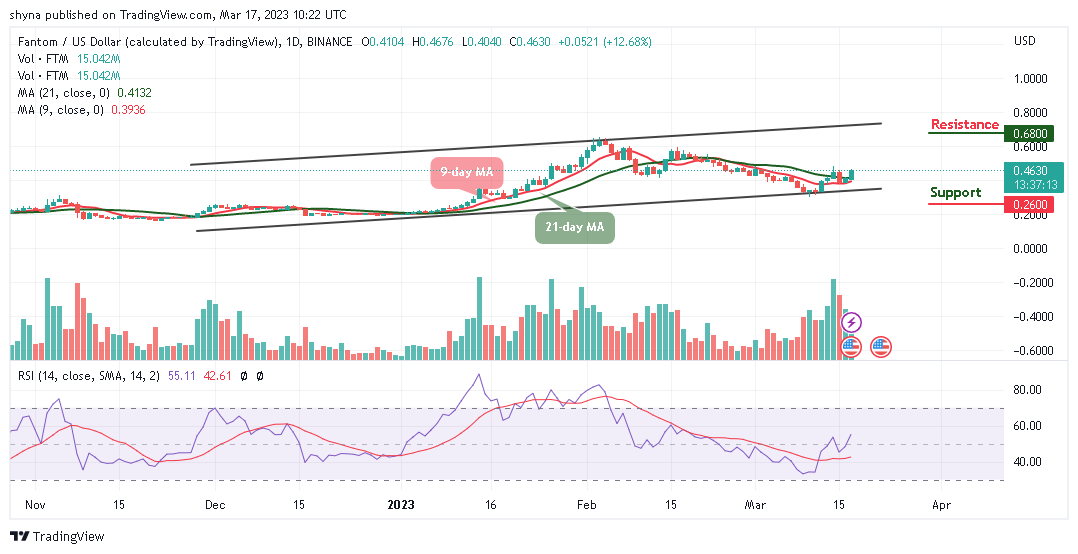
FTM/USD is showing positive movement since yesterday as the market price crosses above the 9-day and 21-day moving averages. Apart from this, the Fantom price still needs to move near the upper boundary of the channel and traders can expect the price to continue to rise as soon as this is done.
Fantom Price Prediction: Fantom Price Will Shoot to the North
The daily chart shows that the Fantom price is attempting to create a new positive trend, and traders may expect a bullish continuation towards the upper boundary of the channel which could test the resistance level of $0.60. Similarly, the technical indicator reveals Relative Strength Index (14) is moving to cross above the 60-level and crossing above this barrier may locate the potential resistance levels at $0.68, $0.70, and $0.72 in the long term.
Moreover, if the Fantom price continues the rising channel pattern, traders may witness additional bullish trends in the coming trading sessions. Meanwhile, a bearish breakdown may likely play out for this market if the Fantom price withdraws back below the 9-day and 2-day moving averages, and this could roll the coin back to the long-term supports at $0.26, $0.24, and $0.22.
Against Bitcoin, the Fantom price follows the bullish movement as the coin moves to the upside. However, if the coin crosses above the 21-day moving average, the market is likely to keep releasing more bullish pressure as the technical indicator Relative Strength Index (14) moves to cross above the 50-level, which indicates that more bullish signals are likely to play out.

In other words, if FTM/BTC falls and slides below the lower boundary of the channel, it may bring the coin to the nearest support at 1500 SAT, and any further bearish movement could lower the price to the support level of 1000 SAT and below. Nevertheless, if the coin continues to follow a bullish movement and heads to the upside, traders could see a bull run to the resistance level of 2500 SAT and above.
Alternatives to Fantom
The Fantom price may remain on the positive side should the 9-day moving average cross above the 21-day moving average. Meanwhile, FTM/USD could reach the resistance level of $0.50 if the bulls focus on the upward trend. Nevertheless, as an investor, you can vote to earn and by staking LHINU tokens, users can participate in the latest polls and earn tokens for voting. Eventually, the community will decide which polls it wants to create as almost $1 has been raised in the ongoing presale.
Join Our Telegram channel to stay up to date on breaking news coverage